
30. Status
30.1. Device
System information is located at Status > Device.
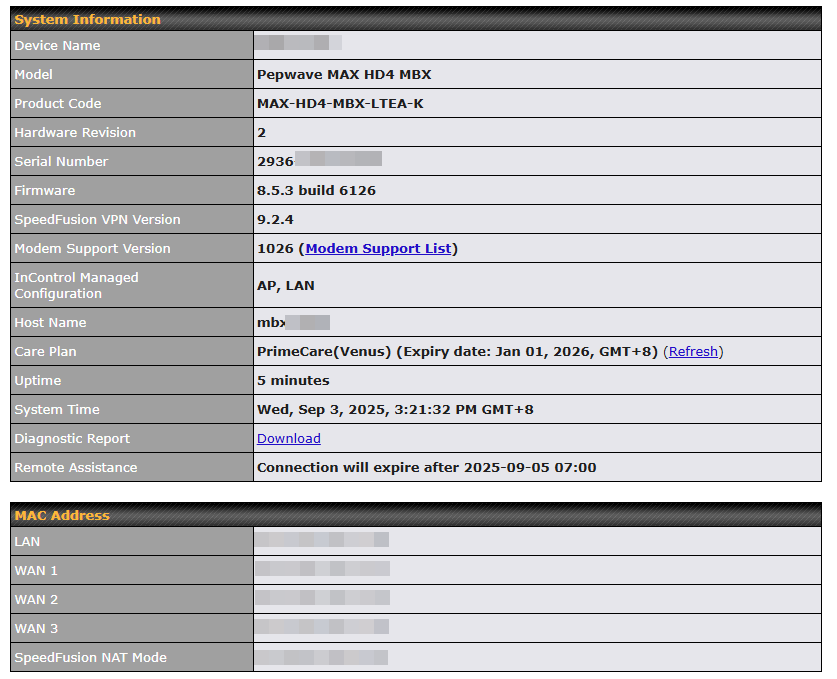
System Information | |
Device Name | This is the name specified in the Device Name field located at System > Admin Security. |
Model | This shows the model name and number of this device. |
Product Code | If your model uses a product code, it will appear here. |
Hardware Revision | This shows the hardware version of this device. |
Serial Number | This shows the serial number of this device. |
Firmware | This shows the firmware version this device is currently running. |
Care Plan | Display care plan status and expiry date. Note: Refresh button to manually refresh the PrimeCare license. Users who have disabled InControl management may click [Refresh] option to check the PrimeCare license status after a renewal. |
SpeedFusion VPN Version | This shows the current SpeedFusion VPN version. |
Modem Support Version | This shows the modem support version. For a list of supported modems, click Modem Support List. |
InControl Managed Configuration | InControl Managed Configurations (firmware, VLAN, Captive Portal, etcetera) |
Host Name | The host name assigned to the Peplink router appears here. |
Uptime | This shows the length of time since the device has been rebooted. |
System Time | This shows the current system time. |
OpenVPN Client Profile | Link to download OpenVPN Client profile when this is enabled in Remote User Access |
Diagnostic Report | The Download link is for exporting a diagnostic report file required for system investigation. |
Remote Assistance | This option is to Turn on remote assistance with the time duration. |
The second table shows the MAC address of each LAN/WAN interface connected. To view your device’s End User License Agreement (EULA), click  Legal.
30.2. Active Sessions
Information on active sessions can be found at Status > Active Sessions > Overview.
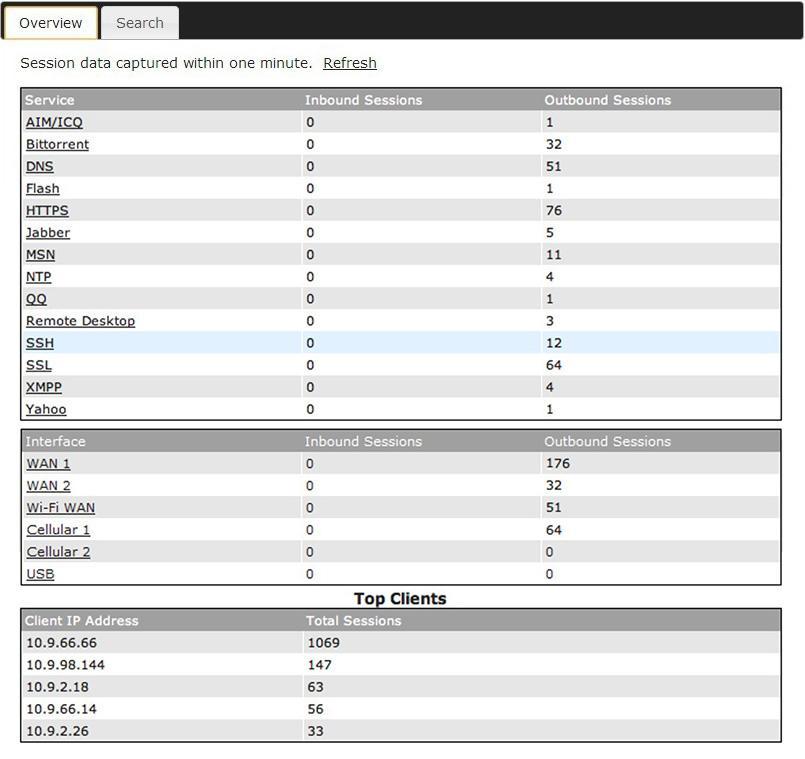
This screen displays the number of sessions initiated by each application. Click on each service listing for additional information. This screen also indicates the number of sessions initiated by each WAN port. In addition, you can see which clients are initiating the most sessions.
You can also perform a filtered search for specific sessions. You can filter by subnet, port, protocol, and interface. To perform a search, navigate to Status > Active Sessions > Search.
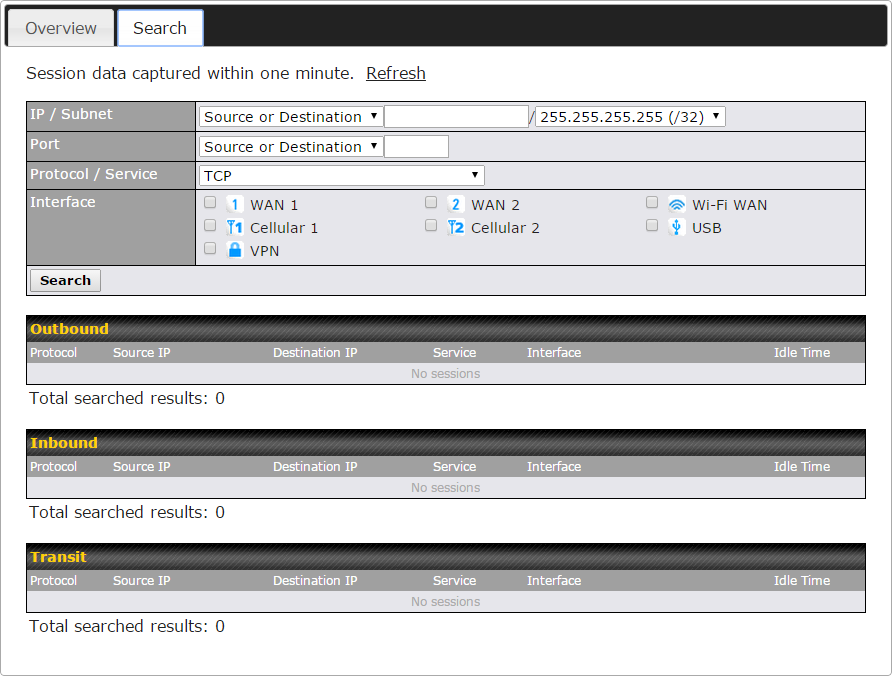
This Active Sessions section displays the active inbound/outbound sessions of each WAN connection on the Peplink router. A filter is available to sort active session information. Enter a keyword in the field or check one of the WAN connection boxes for filtering.
30.3. Client List
The client list table is located at Status > Client List. It lists DHCP and online client IP addresses, names (retrieved from the DHCP reservation table or defined by users), current download and upload rate, and MAC address.
Clients can be imported into the DHCP reservation table by clicking the  button on the right. You can update the record after import by going to Network > LAN.
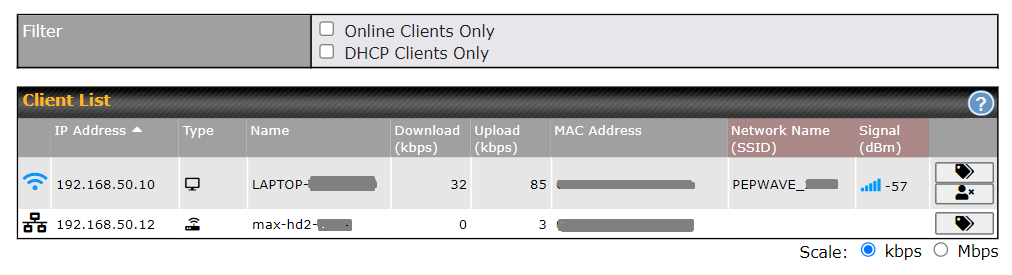
If the PPTP server, SpeedFusionTM , or AP controller is enabled, you may see the corresponding connection name listed in the Name field.
In the client list table, there is a “Ban Client” feature which is used to disconnect the Wi-Fi and Remote User Access clients by clicking the  button on the right.
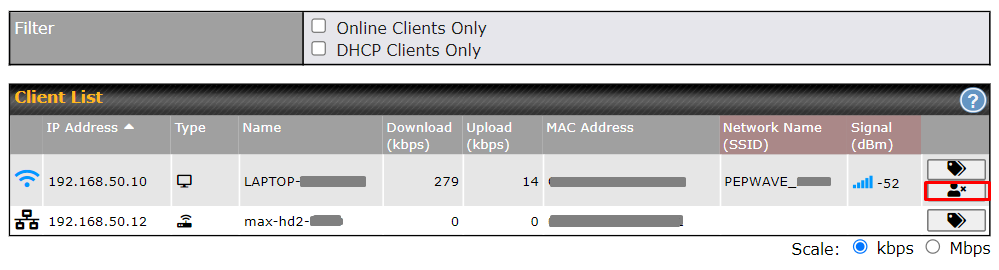
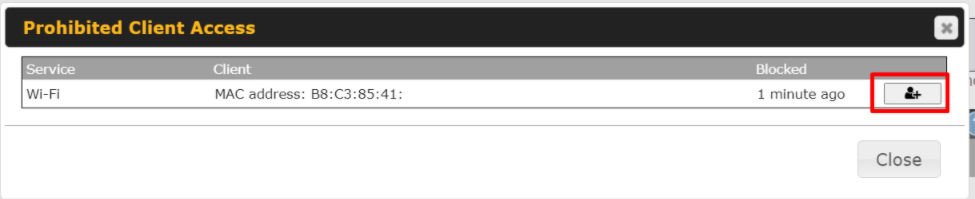
There is a blocklist on the same page after you have banned the Wi-Fi or Remote User Access clients.

You may also unblock the Wi-Fi or Remote User Access clients when the client devices need to reconnect to the network by clicking  the button on the right.
30.4. UPnP / NAT-PMP
The table that shows the forwarded ports under UPnP and NAT-PMP protocols is located at Status > UPnP/NAT-PMP. This section appears only if you have enabled UPnP / NAT-PMP.
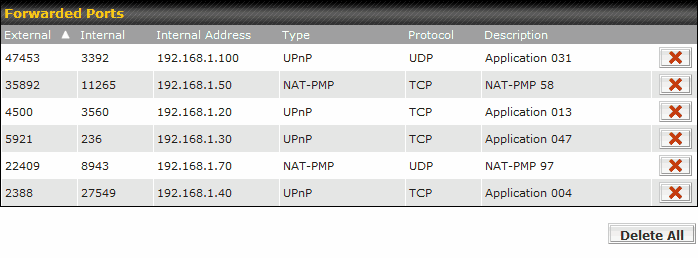
Click  to delete a single UPnP / NAT-PMP record in its corresponding row. To delete all records, click Delete All on the right-hand side below the table.
Important Note |
UPnP / NAT-PMP records will be deleted immediately after clicking the button |
 or Delete All, without the need to click Save or Confirm.
30.5. OSPF & RIPv2
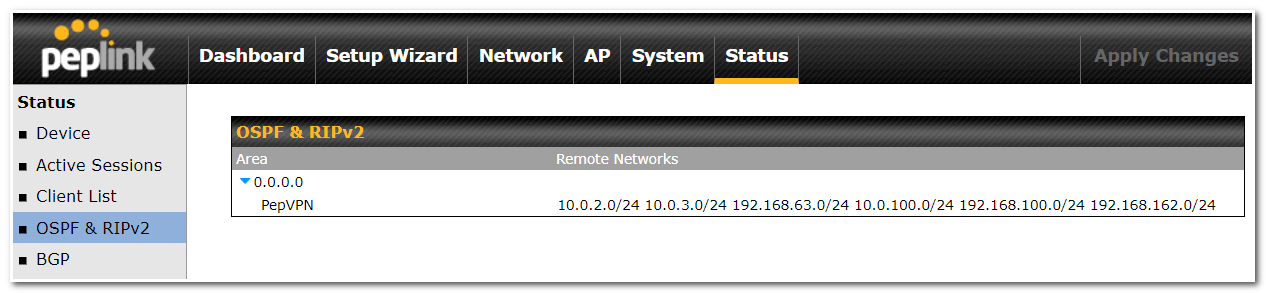
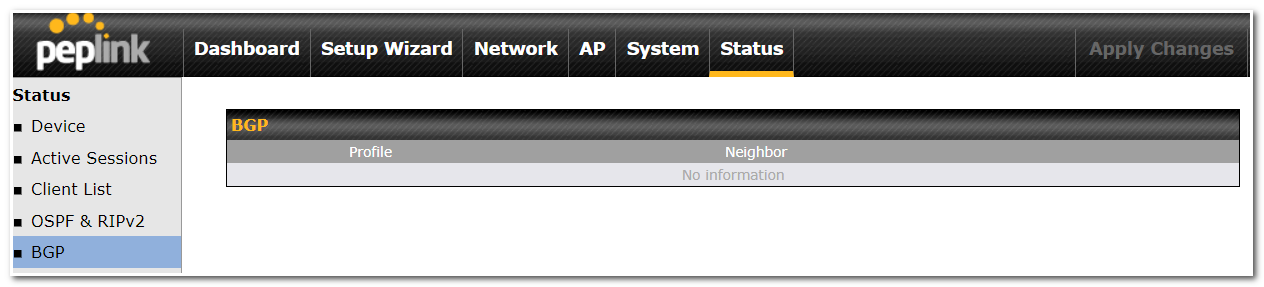
The table shows the status of OSPF and RIPv2.
30.6. BGP
The table shows the status of BGP.
30.7. SpeedFusion VPN
Current SpeedFusion VPN status information is located at Status > SpeedFusion VPN.
Details about SpeedFusion VPN connection peers appear as below:
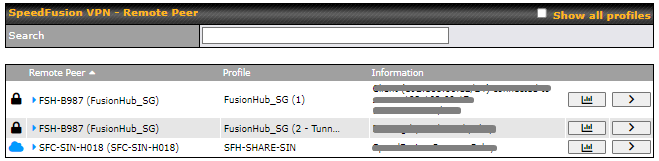
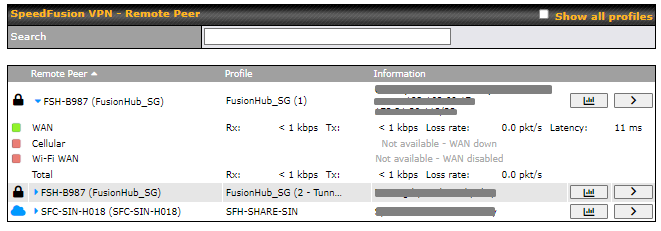
Click on the corresponding peer name to explore the WAN connection(s) status and subnet information of each VPN peer.
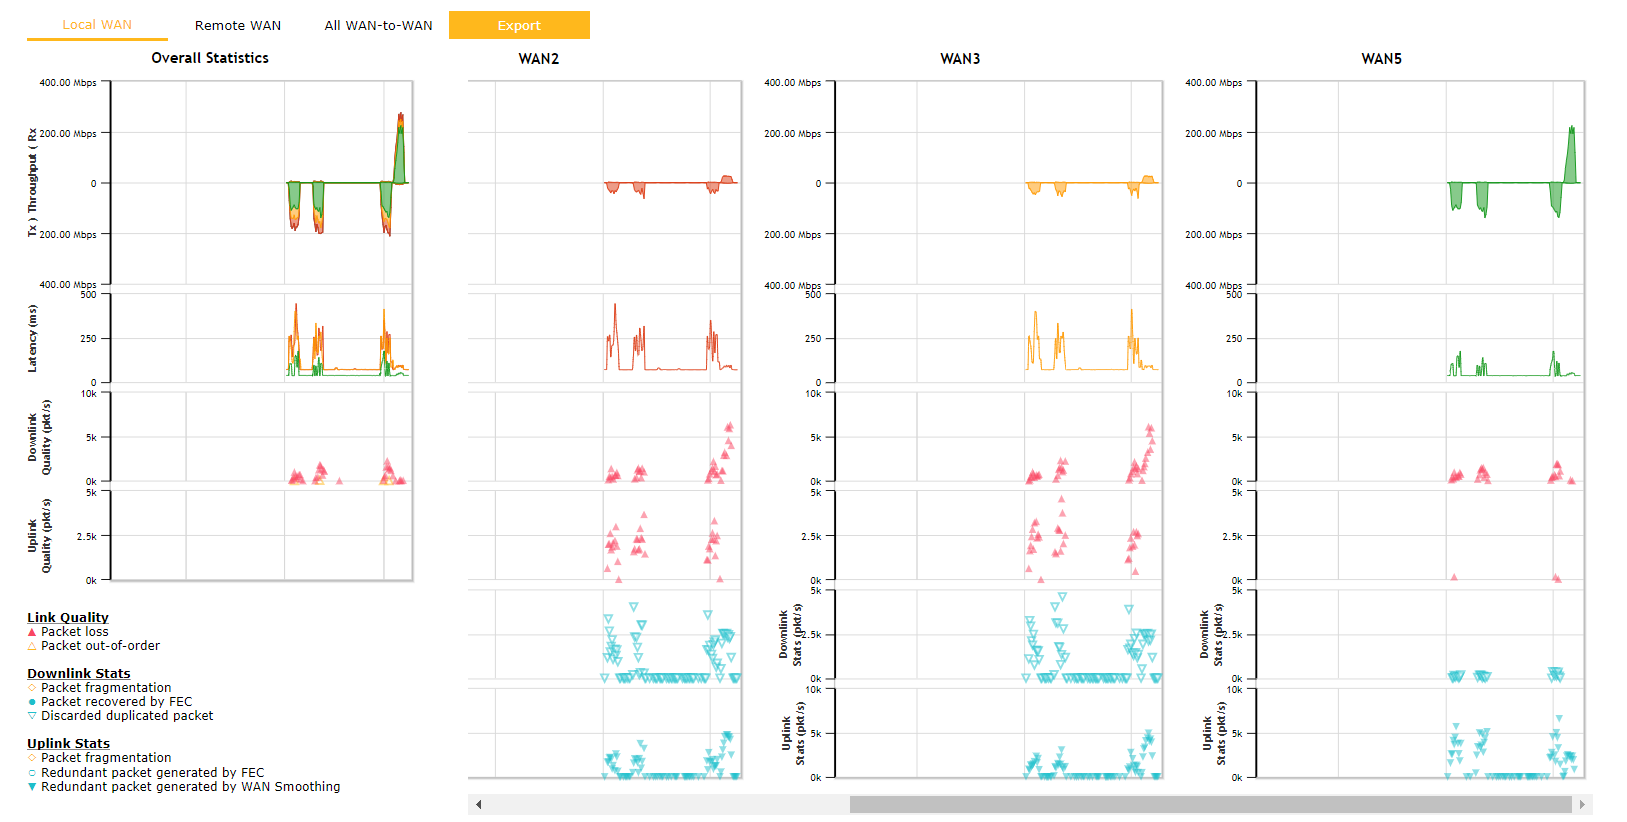
Click the  button for a SpeedFusion chart displaying real-time throughput, latency, and drop-rate information for each WAN connection.
When pressing the  button, the following menu will appear:
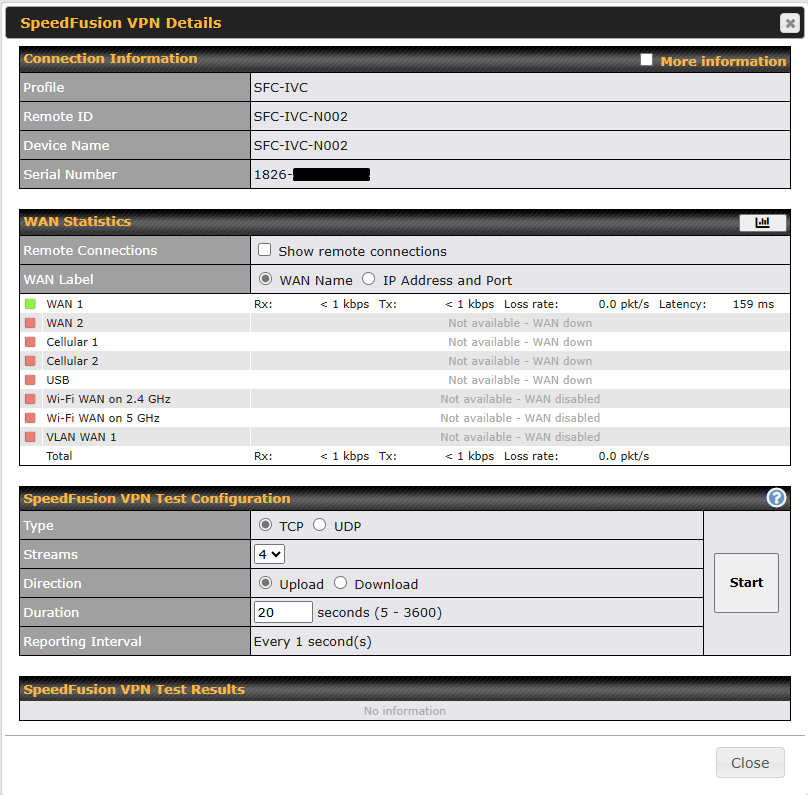
The connection information shows the details of the selected SpeedFusion VPN profile, consisting of the Profile name, Router ID, Router Name, and Serial Number of the remote router.
Advanced features for the SpeedFusion VPN profile will also be shown when the More Information checkbox is selected.
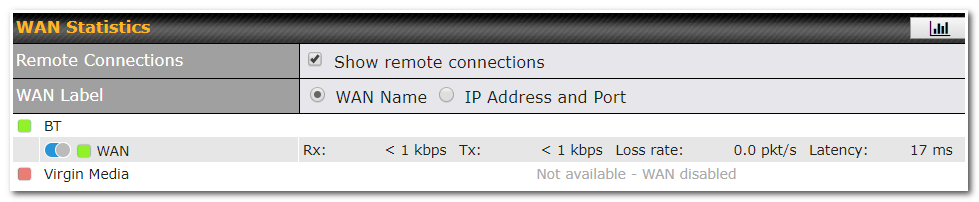
The WAN statistics show information about the local and remote WAN connections (when showing Remote connections) is selected.
The available details are the WAN Name, IP address, and port used for the SpeedFusion connection. Rx and Tx rates, Loss rate, and Latency.
Connections can be temporarily disabled by sliding the switch button next to a WAN connection to the left.
The wan-to-wan connection disabled by the switch is temporary and will be re-enabled after 15 minutes without any action.
This can be used when testing the SpeedFusion VPN’s speed between two locations to see if there is interference or network congestion between certain WAN connections.
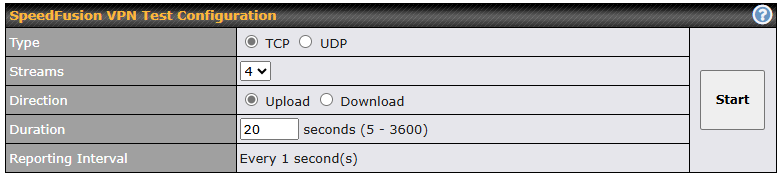
The SpeedFusion VPN test configuration allows us to configure and perform thorough tests.
This is usually done after the initial installation of the routers and in case there are problems with aggregation.
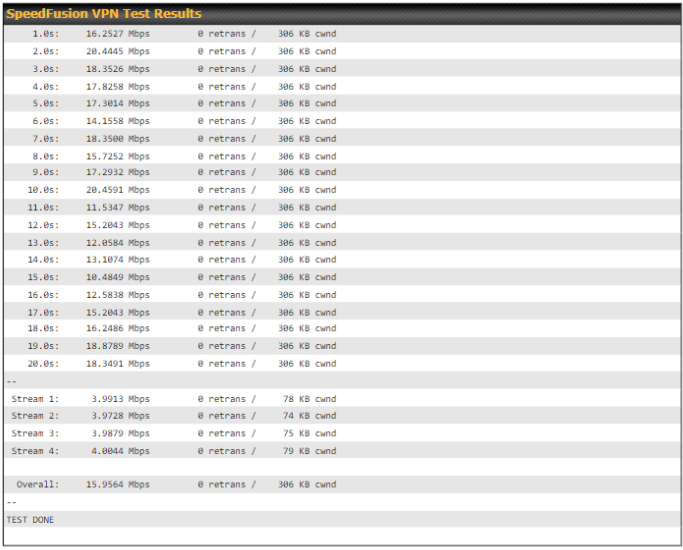
Press the Start button to perform the throughput test according to the configured options.
If TCP is selected, 4 parallel streams will be generated by default to obtain optimal results. This can be customized by selecting a different value of streams.
Duration can be set from a minimum of 5 seconds to a maximum of 3600 seconds. The reporting interval will increase based on the entered duration.
Duration (seconds) | Reporting Interval (seconds) |
5 - 600 | 1 |
601 - 1200 | 2 |
1201 - 2400 | 5 |
2401 - 3600 | 10 |
Using more streams will usually give better results if the latency of the tunnel is high.
Peplink also published a whitepaper about SpeedFusion which can be downloaded from the following url:
http://download.peplink.com/resources/whitepaper-speedfusion-and-best-practices-2019.pdf
30.8. Event Log
Event log information is located at Status > Event Log.
30.8.1. Device Event Log
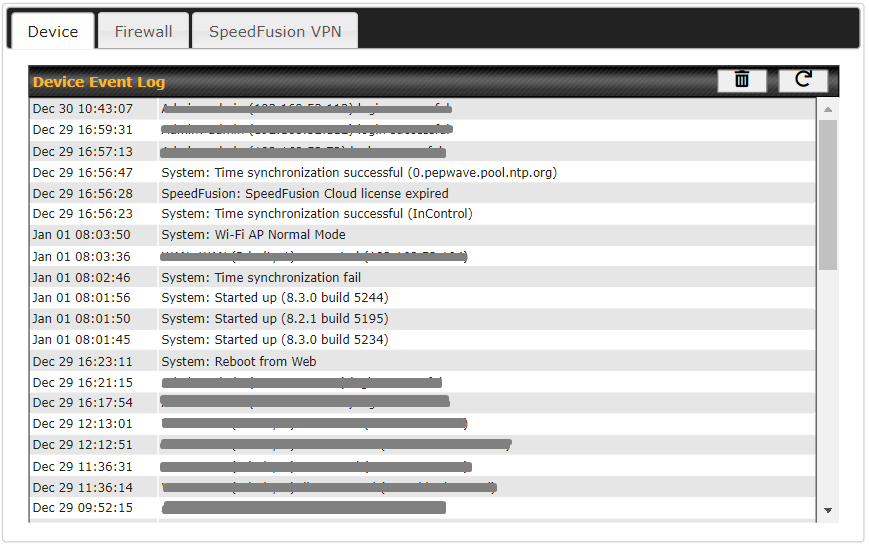
The log section displays a list of events that have taken place on the Peplink router. Click the  to refresh log entries automatically. Click the
 button to clear the log.
30.8.2. Firewall Event Log
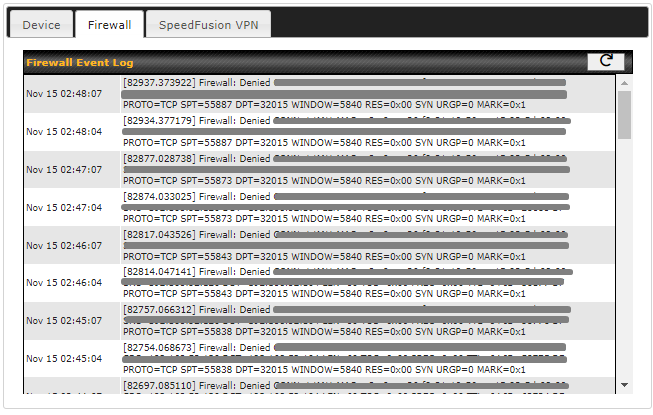
This section displays a list of events that have taken place within a firewall. Click the  button and the log will be refreshed.
30.8.3. SpeedFusion VPN Event Log
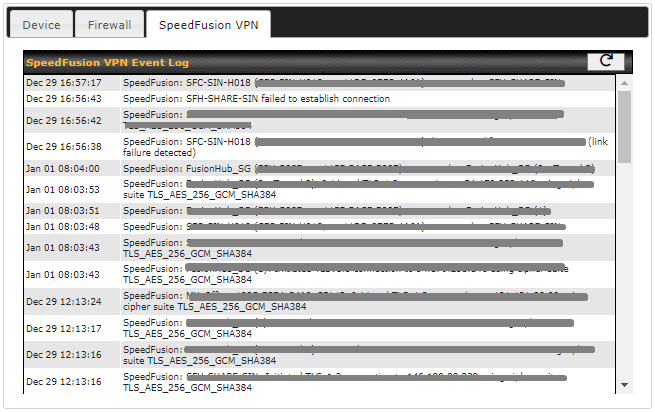
This section displays a list of events that have taken place within a SpeedFusion VPN connection. Click the  button and the log will be refreshed.