
25. AP Controller Status
25.1. Info
A comprehensive overview of your AP can be accessed by navigating to AP > Controller Status > Info.
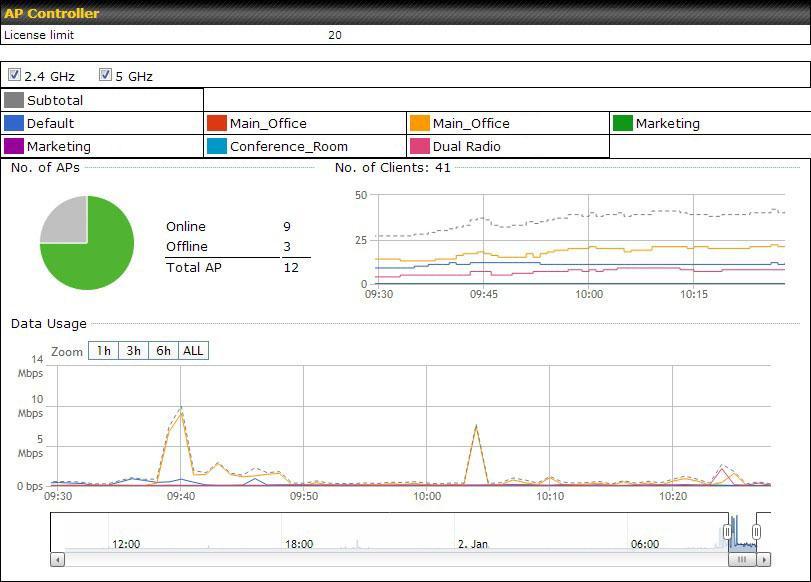
AP Controller | |
License Limit | This field displays the maximum number of APs your router can control. You can purchase licenses to increase the number of APs you can manage. |
Frequency | Underneath, there are two checkboxes labeled 2.4 GHz and 5 GHz. Clicking either checkbox will toggle the display of information for that frequency. By default, the graphs display the number of clients and data usage for both the 2.4 GHz and 5 GHz frequencies. Note: The 6 GHz checkbox is only available on supported models. (Refer to Release Note - 8.6.0 RC4 #25032.) |
SSID | The colored boxes indicate the SSID to display information for. Clicking any colored box will toggle the display of information for that SSID. By default, all the graphs show information for all SSIDs. |
No. of APs | This pie chart and table indicate how many APs are online and how many are offline. |
No.of Clients | This graph displays the number of clients connected to each network at any given time. Mouse over any line on the graph to see how many clients connected to a specific SSID for that point in time. |
Data Usage | This graph enables you to see the data usage of any SSID for any given time period. Mouse over any line on the graph to see the data usage by each SSID for that point in time. Use the buttons next to Zoom to select the time scale you wish to view. In addition, you could use the sliders at the bottom to further refine your timescale. |
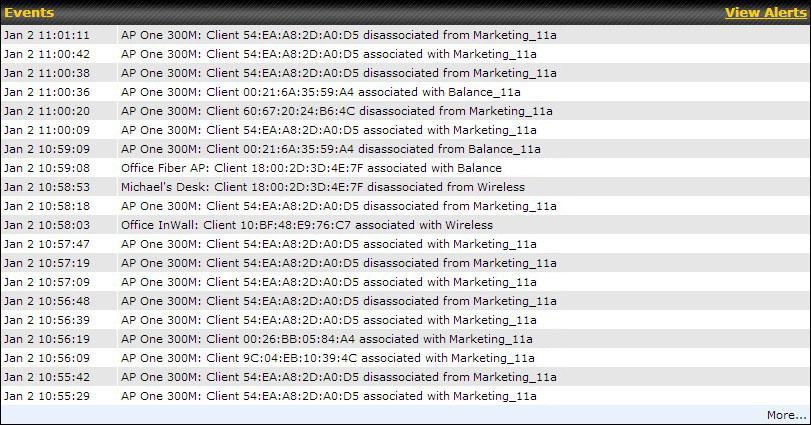
Events |
This event log displays all activity on your AP network, down to the client level. Click View Alerts to see only alerts, and click the More… link for additional records. |

This allows users to configure AP Time Settings (both Timezone and NTP) in AP Controller.
AP Time Settings | |
Time Zone | This field is to select the time zone for the AP controller. |
Time Server | This field is to select the time server for the AP controller. |

This setting is to allow users to manage external AP's controller unreachable action. When Manage Unreachable Action is checked, there will be 2 options which are "None" and "Radio Off".

This is an option to enable client load balancing for AP Controller. When the option is enabled, it is trying to balance the station count on APs within the same profile.
25.2. Access Point
A detailed breakdown of data usage for each AP is available at AP > Controller Status > Access Point.

Managed APs | |
Managed APs | This table shows detailed information for each AP, including the channel, number of clients, upload traffic, and download traffic. Click the blue arrows to the left of the table to expand and collapse information for each device group. To the right of the table, you will see the following icons: Click the
Click the
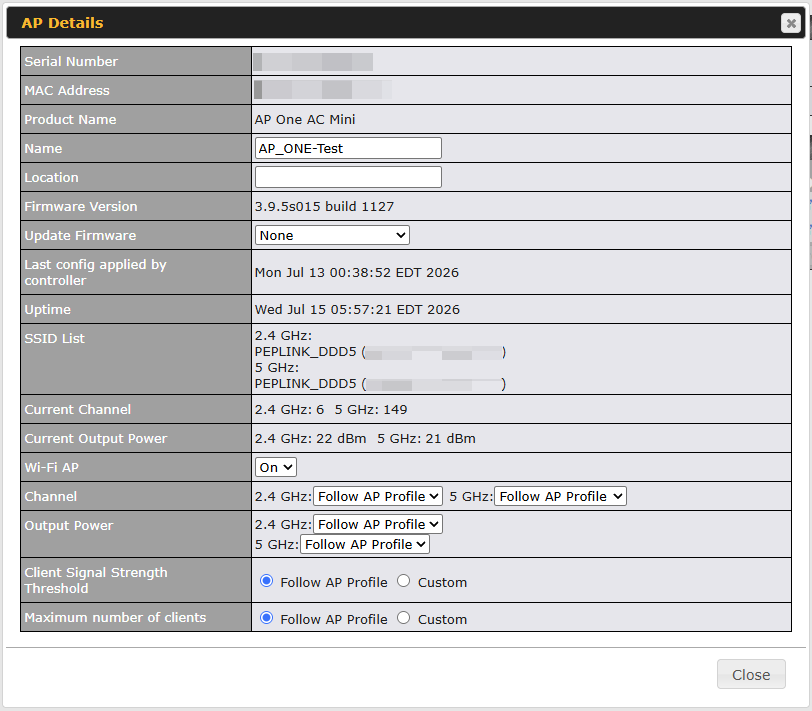
For easier network management, you can give each client a name and designate its location. You can also designate which firmware pack (if any) the client will follow, as well as the channels on which it will broadcast. Click the
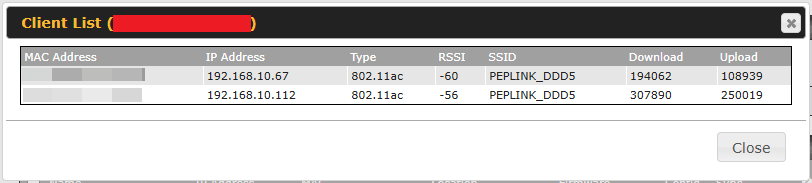
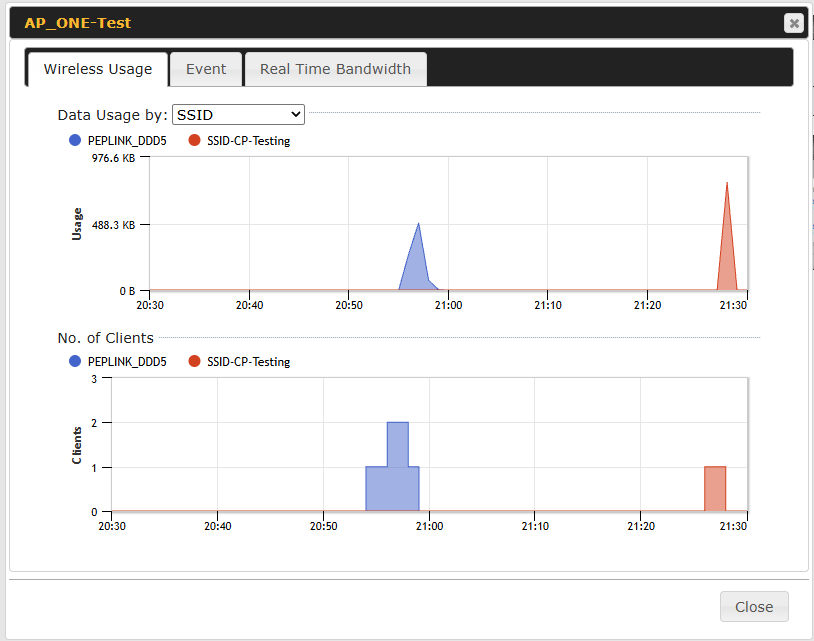
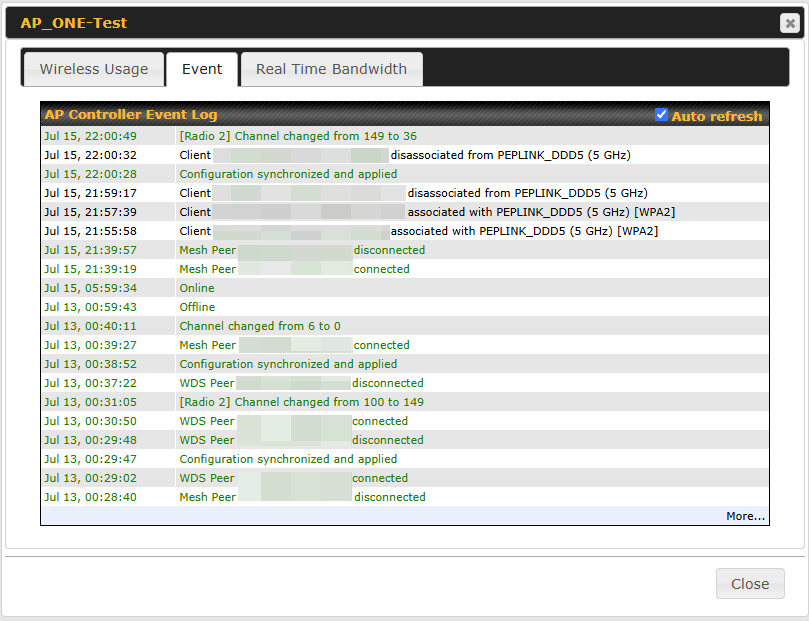
Click any point on the graph to display detailed usage and client information for that device, using that SSID, at that point in time. From the Data Usage by menu, you can display the information by SSID or by AP send/receive rate. Click the Event tab next to Wireless Usage to view a detailed event log for that particular device:
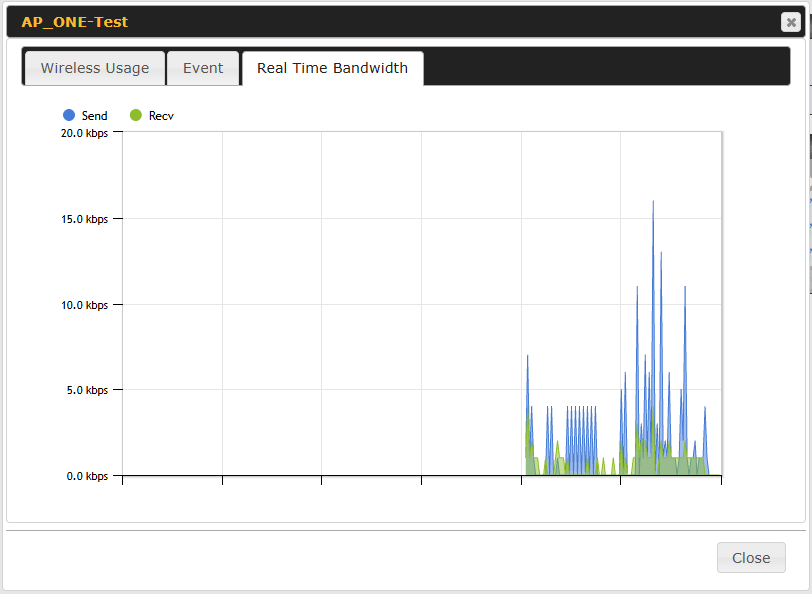
Click the Real Time Bandwidth tab next to Event to view live bandwidth usage.
|




25.3. Wireless SSID
In-depth SSID reports are available under AP > Controller Status > Wireless SSID.
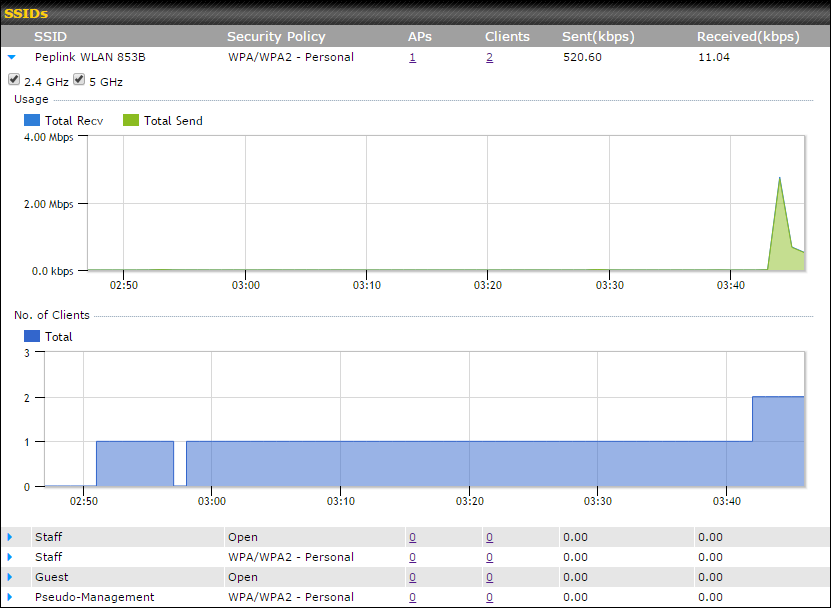
Click the blue arrow on any SSID to obtain more detailed usage information on each SSID.
25.4. Wireless Client
You can search for specific Wi-Fi users by navigating to AP > Controller Status > Wireless Client.
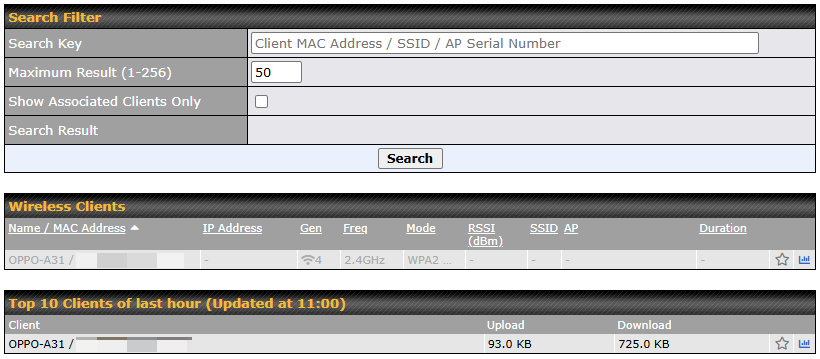
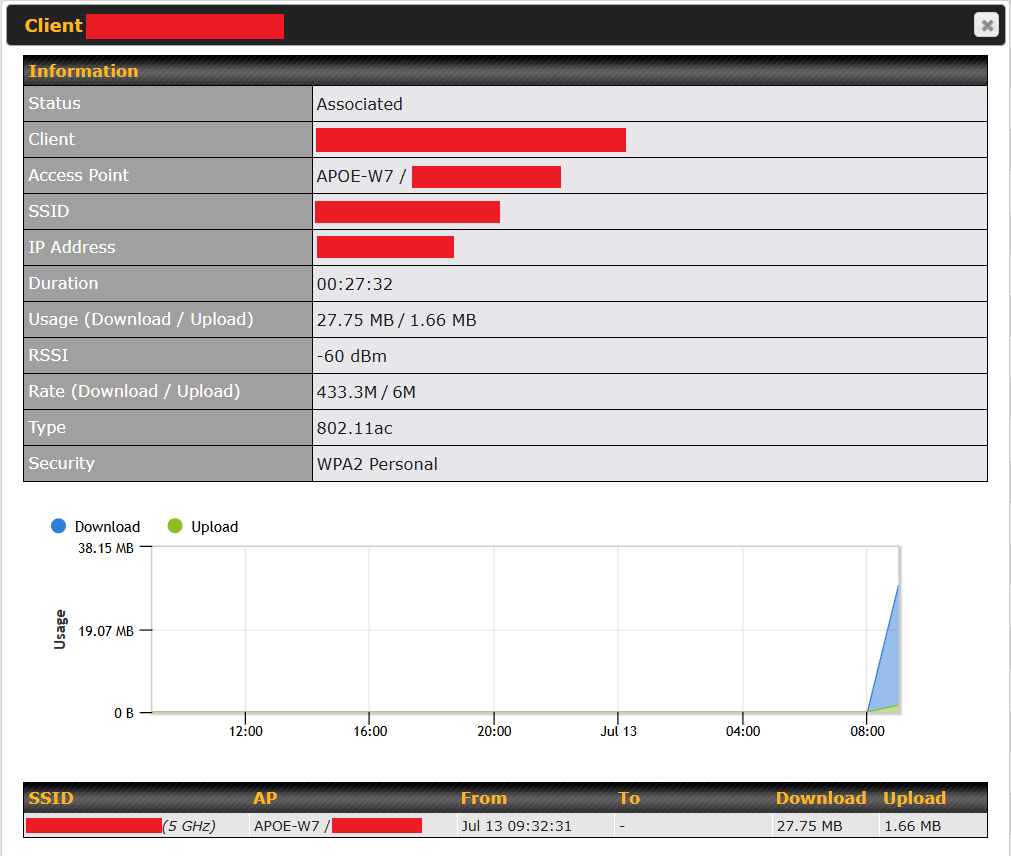
Here, you can see your network’s heaviest users as well as search for specific users. Click the  icon to bookmark specific users, and click the
 icon for additional details about each user:
25.5. Mesh / WDS
Mesh / WDS allows you to monitor the status of your wireless distribution system (WDS) or mesh and track activity by MAC address by navigating to AP > Controller Status > Mesh / WDS.
WDS Link Information
This table shows detailed information for each AP, including Wi-Fi generation, frequency, transmit rate (sent/received), signal strength, and duration.

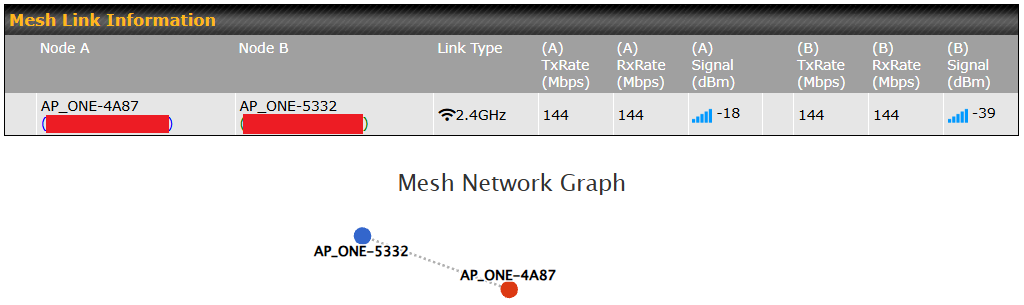
Mesh Link Information
This table shows detailed information for each mesh AP, including the connected node, link type, transmit rate, signal strength, and duration. The Mesh Network Graph is available below the table.
25.6. Nearby Device
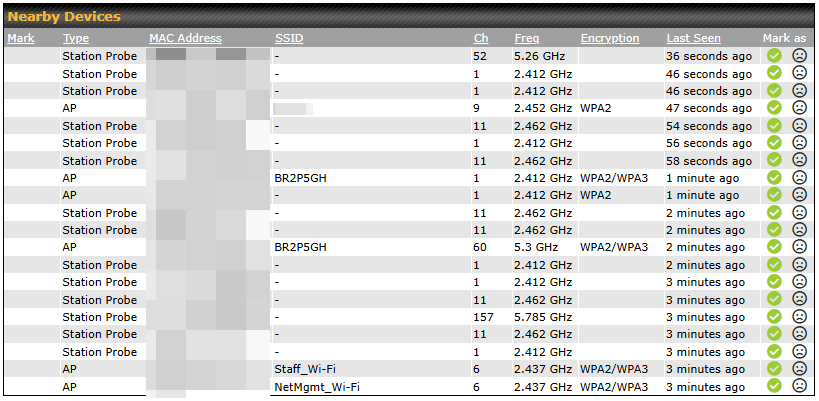
A listing of nearby devices can be accessed by navigating to AP > Controller Status > Nearby Device.
Suspected Rogue Devices |
Hovering over the device MAC address will result in a popup with information on how this device was detected. Click the |
 icons and the device will be moved to the bottom table of identified devices.
25.7. Event Log
You can access the AP Controller Event log by navigating to AP > Controller Status > Event Log.
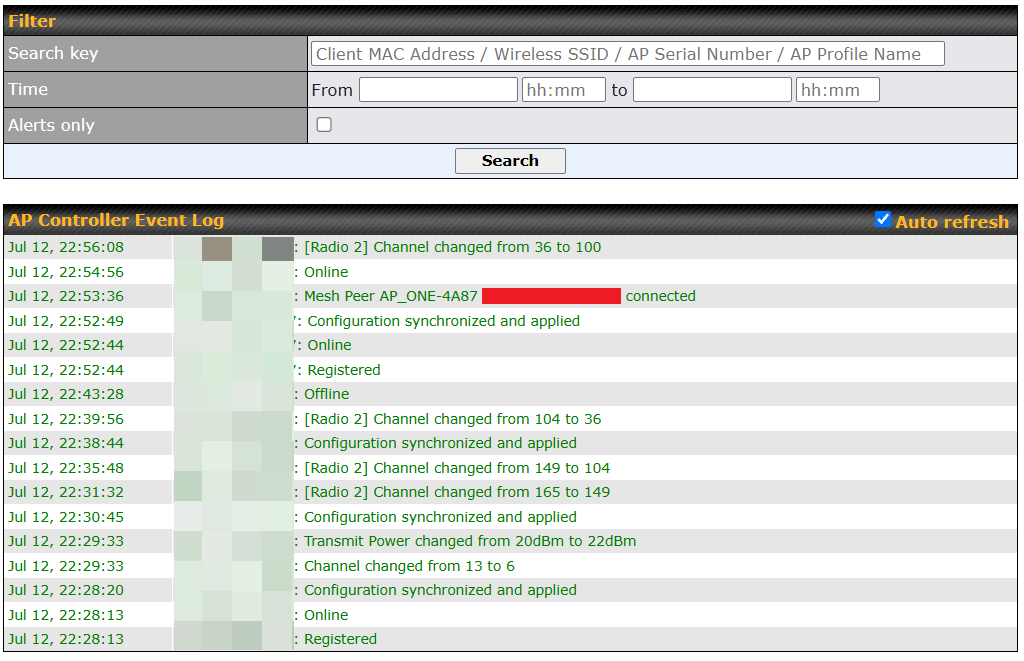
AP Controller Event Log |
This event log displays all activity on your AP network, down to the client level. Use the filter box to search by MAC address, SSID, AP Serial Number, or AP Profile name. Click the More… link for additional records. |