
11. Reports
Reports contains the group level reporting screens: traffic and client summaries, Wi-Fi activity, cellular and Starlink data pools, captive portal activity, connection tests, the event log and the tag list. All screens in this chapter are read only, with these exceptions:
- SIM Card Reports and Starlink Data Pools also define data pools and quotas.
- Tags allows tag descriptions to be edited.
All screens are reached from the group-level menu and cover the devices in the selected group.
Each report screen has its own period selector. The available periods and the retention differ between screens. The options for each screen are listed below.
Five of these reports can be e-mailed on a fixed schedule: Device Reports, Wi-Fi Reports, Usage Reports, Captive Portal Reports and Connection Test Reports. Set the frequency (Monthly, Weekly, Daily) and the recipients for each report at Group > Settings > Report E-mailing. See Report E-mailing in the Settings (Group Level) chapter (13.8 Report E-mailing (Group Level)). Other e-mail addresses is the only recipient option not tied to an InControl 2 role. Use it for recipients without an InControl 2 account.
11.1. Which Report Answers Which Question
The table below lists the screen to use for each type of question.
Question | Screen | See |
Was each device up, and in contact with InControl 2, over a period? | Device Reports, Top Devices, Device Availability and Internet Availability | |
How much data did the group, a product line or a tagged set of devices use, per WAN? | Usage Reports | |
Which clients used the most data? | Device Reports, Top Clients by Usage | |
Which SSIDs carried clients and traffic? | Wi-Fi Reports, SSID Usage | |
Which SIMs or Starlinks are close to their quota? | SIM Card Reports, Starlink Data Pools | 11.5 SIM Card Reports (Group Level), 11.6 Starlink Data Pools (Group Level) |
How did one Starlink perform (latency, obstruction, packet loss)? | Starlink Reports | |
How many guests used the captive portal? | Captive Portal Reports | |
How many devices failed the scheduled speed test? | Connection Test Reports | |
What happened, on which device, at what time? | Event Log | |
What depends on a tag before it is changed? | Tags | |
When did each WAN of one device go up and down, and what was its monthly availability? | Device > Reports > Connection Up/Down History, in the Device Reports chapter |
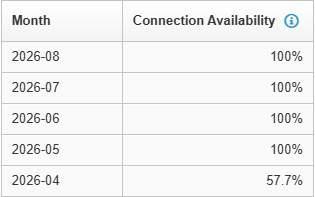
The monthly Connection Availability table on Connection Up/Down History, which answers the last question in the table. It shows one row per month for the selected WAN.
11.2. Device Reports (Group Level)
Summarises data usage, client counts and availability across the devices in the group over a selected period.
Where to find it
Group > Reports > Device Reports
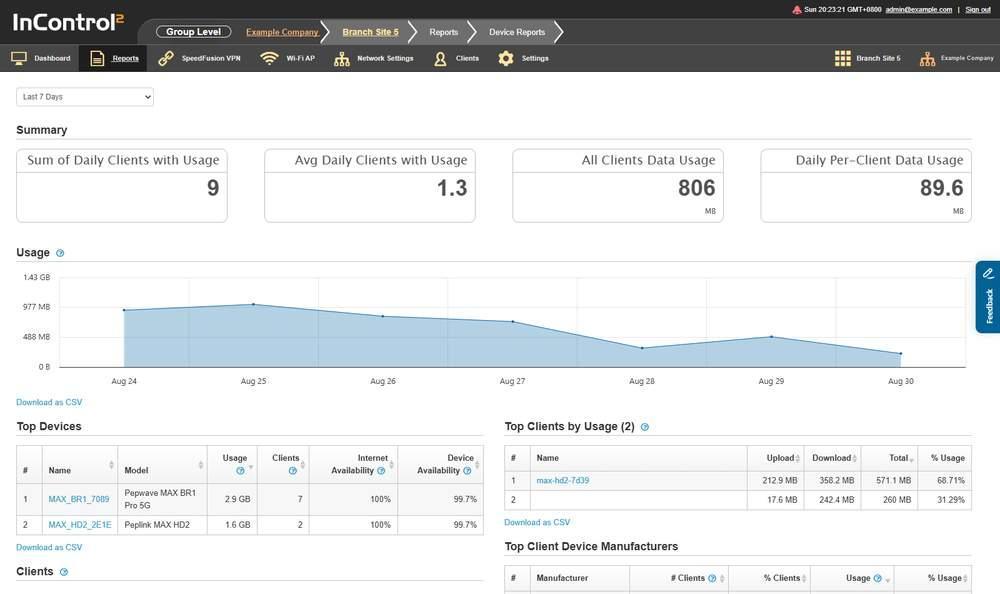
The Device Reports screen. The date range selector is above the Summary panel and applies to every section on the page.
11.2.1. What This Screen Shows
The page is a stack of sections, each with its own heading.
Section | What it shows |
Summary | Sum of Daily Clients with Usage, Avg Daily Clients with Usage, All Clients Data Usage, Daily Per-Client Data Usage |
Usage | A bar chart of the data consumed by all clients on all devices for each day in the selected period |
Top Devices | A ranked table of devices |
Clients | A Clients Per Day chart with two series, Clients with usage and Connected Wi-Fi clients |
Top Clients by Usage (2) | A ranked table of client devices |
Top Client Device Manufacturers | A ranked table of manufacturers |
Definitions are shown in tooltips on the section and column headings. Hover over a heading to view its definition.
The number in brackets after Top Clients by Usage is the number of clients listed in that table.
The Clients chart shows the instruction Click on a column to view the day's hourly usage. Click a day in the chart to view its hourly breakdown.
11.2.2. Top Devices

The Top Devices table. Each device name is a link. The question mark icons beside Usage, Clients and the two availability headings show their definitions.
Column | What it shows |
# | Rank within the period |
Name | Device name, which links to the device |
Model | Product model, for example Pepwave MAX BR1 Pro 5G |
Usage | Data consumed on all WAN connections of the device on that row in the selected period |
Clients | Unique clients that accessed devices and consumed data in the period. Each client is counted once, regardless of how many times or on how many days it connected. Clients are identified primarily by MAC address and then by IP address |
Internet Availability | See How availability is calculated below |
Device Availability | See How availability is calculated below |
11.2.3. How Availability Is Calculated
Each availability figure is one quantity divided by another, over the date range selected at the top of the page.
Column | Quantity measured | Measured against |
Internet Availability | Total InControl 2 online time of the device in the period | Total uptime of the device in the period |
Device Availability | Total uptime of the device in the period | Total length of the period |
- Device Availability is the share of the period during which the device was powered and running.
- Internet Availability is the share of that running time during which the device was in contact with InControl 2. It reflects the device's path to the Internet as seen by InControl 2. It is not a per WAN figure.
- For availability per WAN per month, use Device > Reports > Connection Up/Down History (15.12.3 Monthly Availability).
- While a device is offline, InControl 2 does not count its connections as down until the device reconnects, so availability figures can change afterwards. See Connection Up/Down History in the Device Reports chapter (15.12 Connection Up/Down History).
11.2.4. The Clients Chart
The chart plots two series that count different things.
Series | What it counts |
Clients with usage | Unique clients that accessed devices and consumed data on each indicated date |
Connected Wi-Fi clients | Connected Wi-Fi clients only. Ethernet clients are excluded |
Click the bar for any date to open a chart of the connected client count for each hour of that day.
The two views count a long lived client differently.
View | How a client connected for several hours is counted |
Hourly chart | Once in each hour it was connected |
Daily figure | Once for the day, however many hours it was connected |
As a result, the hourly figures can add up to more than the daily figure. Clients are identified primarily by MAC address and then by IP address.
11.2.5. Top Clients by Usage

The Top Clients by Usage table, ranked by Total. The % Usage column shows each client's share of all client usage.
Column | What it shows |
# | Rank within the period |
Name | Client name, which links to the client |
Upload | Data sent by the client |
Download | Data received by the client |
Total | Upload plus download |
% Usage | That client's share of the total client usage |
Each client's figures are the sum of its usage across all devices in the period. A client that moved between devices appears once, with its usage combined.
11.2.6. Top Client Device Manufacturers

The Top Client Device Manufacturers table. Clients that could not be identified are grouped on the Unknown row.
Column | What it shows |
# | Rank within the period |
Manufacturer | Manufacturer identified for the client devices. Clients that cannot be identified are grouped as Unknown |
# Clients | Number of clients from that manufacturer |
% Clients | That manufacturer's share of the client count |
Usage | Data used by those clients |
% Usage | That manufacturer's share of total usage |
Clients that cannot be identified by MAC address are excluded from this table, from both the client counts and the usage figures. As a result, this table can total less than the client tables above it.
11.2.7. Controls on This Screen
Control | What it does |
Date range selector | Sets the period reported on every section of the page |
Download as CSV | Exports the section above it, for the selected period. Usage, Top Devices, Clients, Top Clients by Usage and Top Client Device Manufacturers each have their own link |
The date range selector offers eight options:
- Today
- Yesterday
- Last 7 Days
- Last 31 Days
- Last 91 Days
- Last 182 Days
- Last 12 Months
- Custom
Use Custom for a period that the fixed options do not cover.
The longest fixed period on this screen is Last 12 Months. Other report screens offer different ranges. For example, Captive Portal Reports stops at Last 31 Days.
11.2.8. The Custom Range
Selecting Custom adds two date fields and an Update button below the selector. The report continues to show the previous period until the two dates are set and Update is clicked.
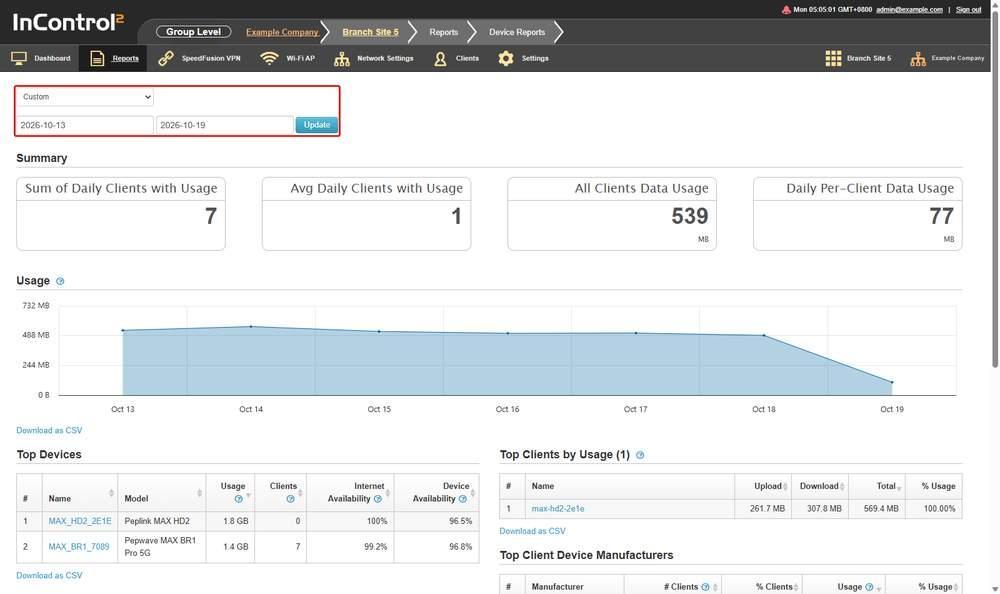
Device Reports with Custom selected. The selector, the two date fields and the Update button are outlined in red. The fields show the period previously displayed.
Field | What it holds |
Left field | Start date of the period |
Right field | End date of the period |
Update | Redraws every section of the page for the dates entered |
Both fields are prefilled with the period displayed before Custom was selected, in the format YYYY-MM-DD.
Every report screen in this chapter that offers Custom uses the same two fields and Update button.
11.3. Wi-Fi Reports (Group Level)
Reports Wi-Fi client activity and SSID usage across the Wi-Fi capable devices in the group.
Where to find it
Group > Reports > Wi-Fi Reports
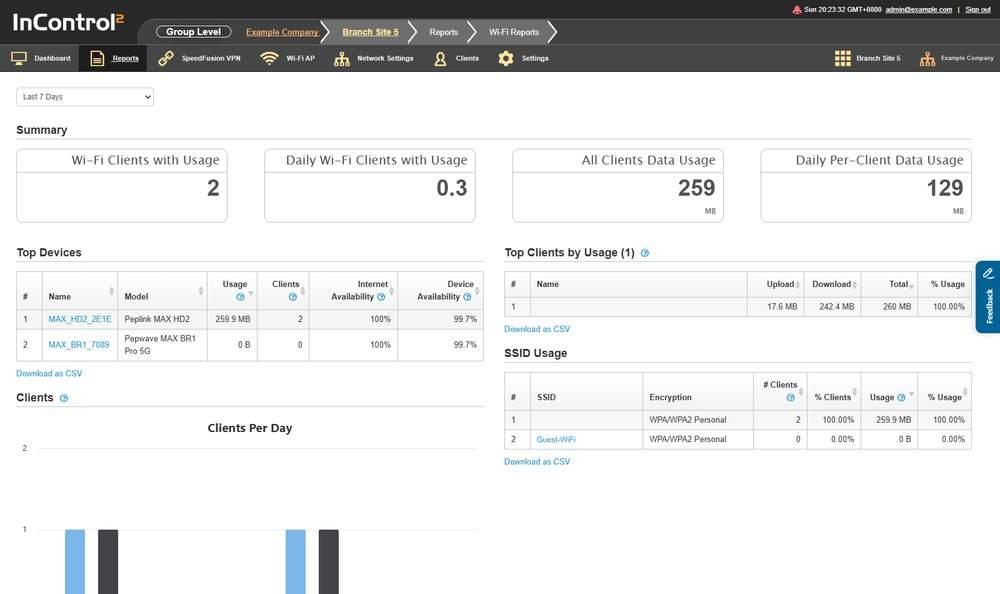
The Wi-Fi Reports screen. The SSID Usage table, in the right-hand column under Top Clients by Usage, is unique to this screen.
11.3.1. What This Screen Shows

Top Devices on Wi-Fi Reports. A device with no Wi-Fi usage in the period is still listed, with 0 B and 0 clients.
Section | What it shows |
Summary | Wi-Fi Clients with Usage, Daily Wi-Fi Clients with Usage, All Clients Data Usage, Daily Per-Client Data Usage |
Top Devices | A ranked table of devices |
Clients | A Clients Per Day chart with two series, Wi-Fi clients with usage and Connected Wi-Fi clients |
Top Client Device Manufacturers | A ranked table of manufacturers |
Top Clients by Usage (1) | A ranked table of client devices |
SSID Usage | A ranked table of SSIDs |
The Clients chart works as on Device Reports and shows the same instruction, Click on a column to view the day's hourly usage. It plots Wi-Fi clients with usage instead of Clients with usage. On both screens, the Connected Wi-Fi clients series excludes Ethernet clients.
Top Devices, Top Clients by Usage and Top Client Device Manufacturers use the same columns and definitions as on Device Reports (11.2.2 Top Devices), including the two availability ratios and the exclusion of clients without an identifiable MAC address. One definition differs: Usage in Top Devices counts data consumed by Wi-Fi clients on Wi-Fi enabled devices, not all traffic on the device.
A device with no Wi-Fi clients in the period still appears in Top Devices, with 0 B of usage and zero clients. A listing in the table does not indicate Wi-Fi activity.
11.3.2. SSID Usage

The SSID Usage table. An SSID with no traffic in the period is still listed, with 0 clients and 0 B.
Column | What it shows |
# | Rank within the period |
SSID | The SSID name |
Encryption | Encryption in use, for example WPA/WPA2 Personal |
# Clients | Wi-Fi clients connected to that SSID across all devices in the period |
% Clients | That SSID's share of the client count |
Usage | Data consumed by Wi-Fi clients on that SSID across all devices in the period |
% Usage | That SSID's share of total usage |
An SSID that carried no traffic in the period is still listed, with zero clients and 0 B of usage.
11.3.3. Controls on This Screen
Control | What it does |
Date range selector | Sets the period reported on every section of the page |
Download as CSV | Exports the section above it. Top Devices, Clients, Top Client Device Manufacturers, Top Clients by Usage and SSID Usage each have their own link |
The date range selector offers the same eight options as Device Reports:
- Today
- Yesterday
- Last 7 Days
- Last 31 Days
- Last 91 Days
- Last 182 Days
- Last 12 Months
- Custom
Custom works as on Device Reports, with date fields in the format YYYY-MM-DD. See 11.2.8 The Custom Range.
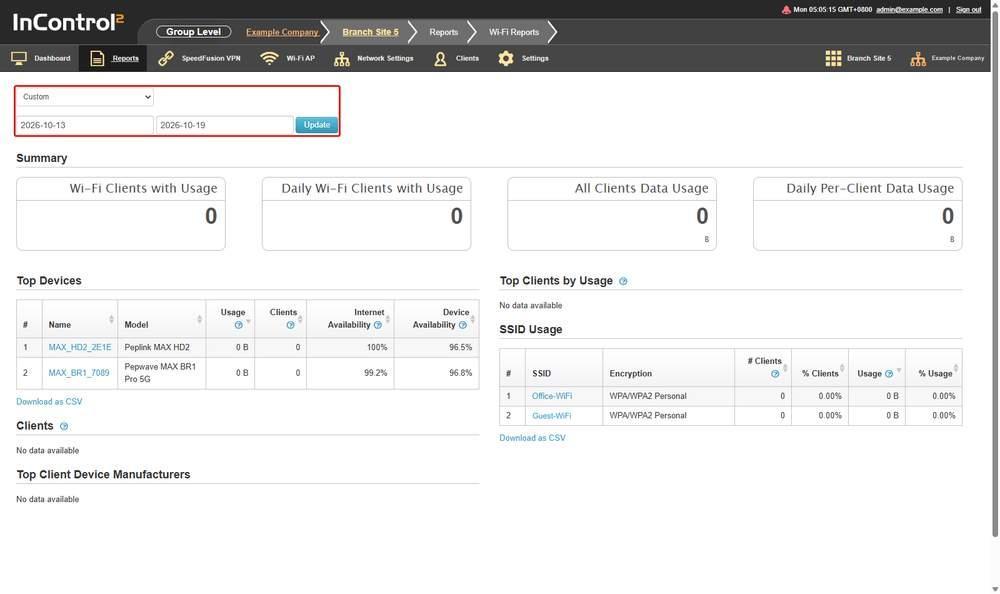
Wi-Fi Reports with Custom selected. The selector, the two date fields and the Update button are outlined in red, above the Summary panel.
11.4. Usage Reports
Builds a data usage report for a selected time granularity, unit, device selection and WAN connection. Use it to see how much data a set of devices used on one WAN type.
For example, to report all cellular usage across devices with a given tag, set Device Selection to By tags, Connection to Cellular\, which combines every cellular connection, and Data Usage to Monthly. See Report parameters*.
Where to find it
Group > Reports > Usage Reports
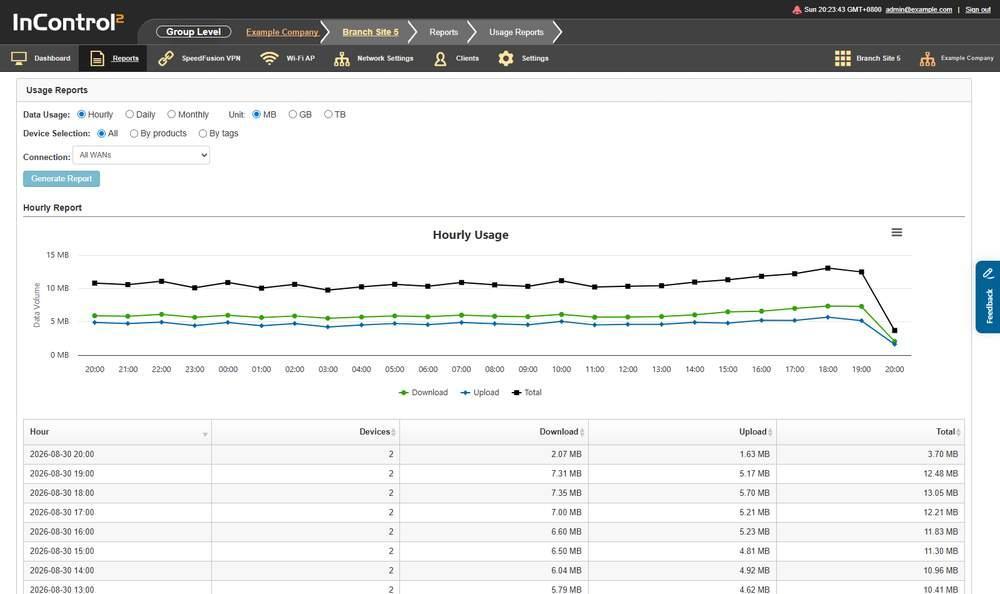
The Usage Reports screen. The report parameters sit in the panel at the top, and the generated report appears beneath as a chart and a table.
11.4.1. Report Parameters
The panel at the top of the page holds four sets of parameters.
Parameter | Options |
Data Usage | Hourly, Daily, Monthly |
Unit | MB, GB, TB |
Device Selection | All, By products, By tags |
Connection | A dropdown of WAN connections |
The Connection dropdown lists All WANs, Cellular\* and the WAN connection names found on the group's devices, for example Cellular, Cellular 1, Cellular 2, USB, VLAN WAN 1, WAN, WAN 1, WAN 2, Wi-Fi WAN on 2.4 GHz and Wi-Fi WAN on 5 GHz.
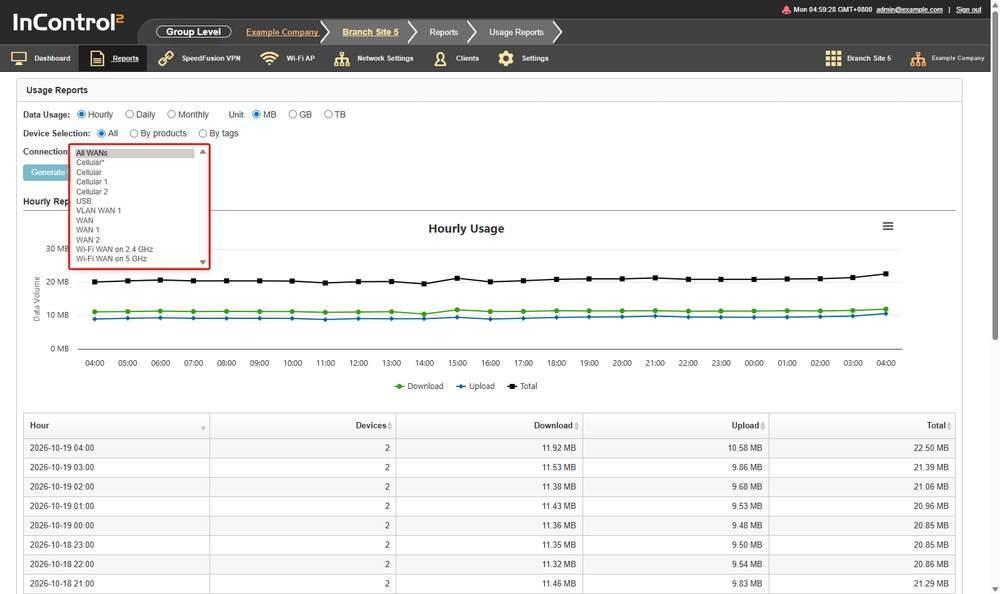
The Connection dropdown, outlined in red, expanded. Cellular* and Cellular are separate entries. All WANs is the default.
All WANs is selected by default.
Cellular\* and Cellular are separate entries:
- Cellular\* combines every cellular connection on the selected devices into one total. Use it for total cellular usage.
- Cellular, like the other entries, is a single connection selected by name, in this case the connection named Cellular on a device.
The list is built from the connection names on the group's devices, so it varies by group. Some entries include a device serial number, for example Cellular 1 - <serial number>.
Device Selection sets which devices are counted. All covers the whole group, By products limits the report to selected product models, and By tags limits it to devices with selected tags. See Tags, 11.12 Tags.
11.4.2. The Generated Report
The report heading follows the Data Usage setting. With Hourly selected, the section is titled Hourly Report and contains a Data Volume chart and a table.
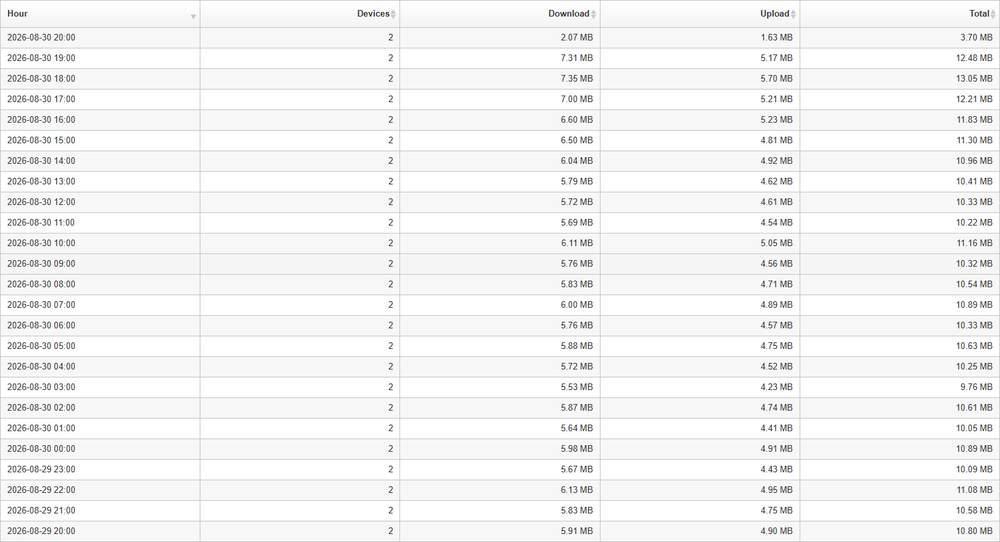
The table below the Hourly Usage chart. Each row is one hour, newest first, with the number of devices counted and the download, upload and total for that hour.
Column | What it shows |
Hour | The hour the row covers, given as date and hour |
Devices | Number of devices contributing to that row |
Download | Data received in that hour |
Upload | Data sent in that hour |
Total | Download plus upload |
The chart above the table plots Download, Upload and Total as Hourly Usage.
11.4.3. The Period Each View Covers
There are no date selectors on this screen. Each Data Usage view covers a fixed rolling window that ends now:
View | Period covered |
Hourly | About the last 25 hours, one row per hour |
Daily | The last 46 days, including today |
Monthly | The last 24 months |
In the Daily view, the current day's row is labelled "Project day-end usage". In the Monthly view, the current month's row is labelled "Project month-end usage". These rows cover a period still in progress. A month with no data is omitted from the Monthly view, not shown as zero.
11.4.4. Controls on This Screen
Control | What it does |
Hourly / Daily / Monthly | Sets the granularity of each report row |
MB / GB / TB | Sets the unit used in the chart and table |
All / By products / By tags | Sets which devices the report covers |
Connection | Limits the report to one WAN connection or to All WANs |
Generate Report | Runs the report with the parameters above. When the screen opens, the report for the default parameters is already displayed below it |
Download as CSV | Exports the generated report table |
11.5. SIM Card Reports (Group Level)
Tracks cellular data usage against carrier and custom SIM pools, and lists the SIM cards installed across the group, with the carrier and band each device is using.
To create a pool for each of several devices in one action, select them at Group > Settings > Device Management and select Create per-device custom SIM pools... from the Actions menu. This creates one custom pool for each selected device that has SIM cards attached. See Create per-device custom SIM pools in the Settings (Group Level) chapter (13.1.10 Create Per-device Custom SIM Pools).
Where to find it
Group > Reports > SIM Card Reports
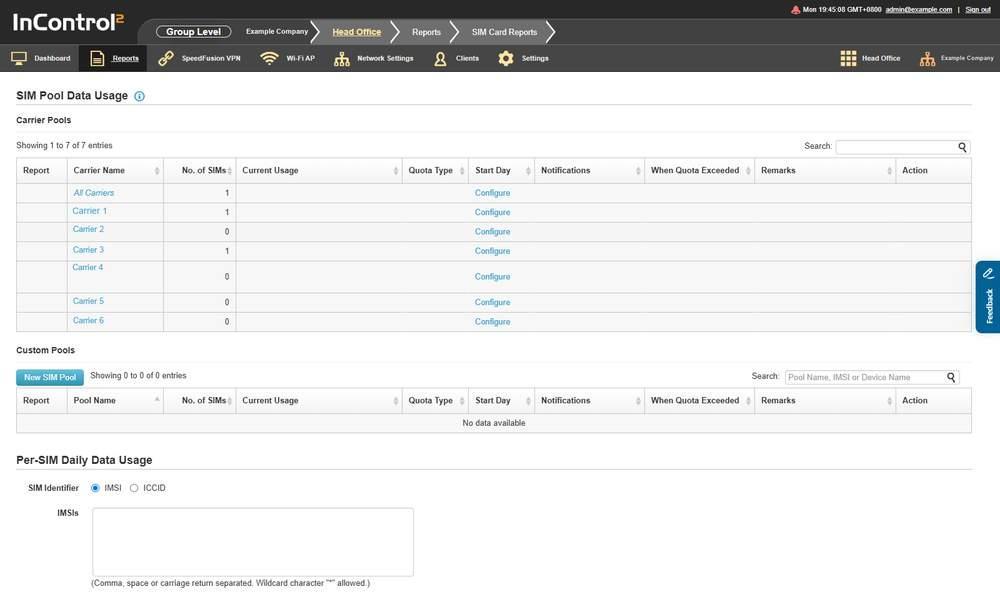
The SIM Card Reports screen. Carrier Pools are created by the system. Custom Pools are user defined.
11.5.1. What a SIM Pool Is
A SIM pool profile monitors the total data usage of a set of SIM cards against a quota across billing cycles. It sends alerts by e-mail, Pushover or HTTP/S, and can stop or throttle user traffic once the quota is exceeded. A shared carrier plan can therefore be controlled from one place.
- SIM cards are specified by IMSI.
- The same IMSI may belong to more than one pool.
- Carrier Pools are generated by the system, one for every carrier plus one for all carriers. Their IMSI membership is maintained automatically.
- Custom Pools are defined and maintained by the user.
11.5.2. What This Screen Shows
Section | What it shows |
SIM Pool Data Usage | The page heading covering the two pool tables |
Carrier Pools | One row per carrier detected in the group, plus an All Carriers row |
Custom Pools | User-defined pools |
Per-SIM Daily Data Usage | A CSV export of daily usage for selected SIMs |
Devices and SIM Cards | The SIM inventory per device |
11.5.3. Carrier Pools and Custom Pools
Both tables use the same columns, except the second column, which shows the carrier in one table and the pool in the other.
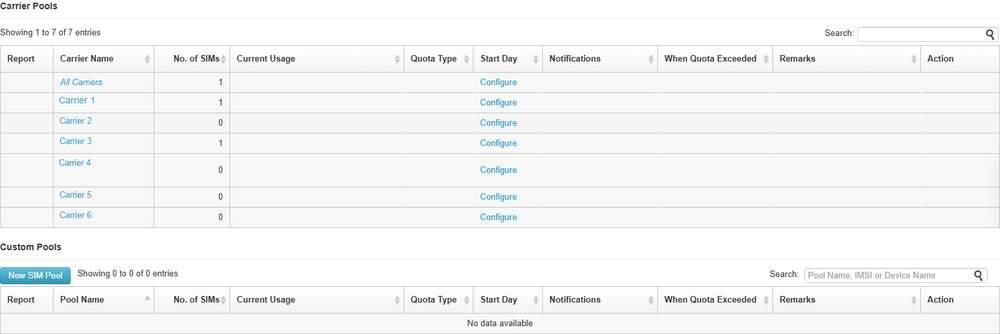
Carrier Pools above Custom Pools. Each carrier row without a quota offers only Configure. The Custom Pools table is below the New SIM Pool button.
Column | What it shows |
Report | Link to the pool's usage report |
Carrier Name / Pool Name | The detected carrier, or the pool name |
No. of SIMs | Number of SIMs counted in the pool |
Current Usage | Data used in the current quota period |
Quota Type | The quota period set for the pool |
Start Day | The day of the month the quota period starts |
Notifications | Notification channels enabled for the pool |
When Quota Exceeded | The action taken once the quota is exceeded |
Remarks | Free text entered for the pool |
Action | Per row actions. Carrier pool rows offer Configure |
Carrier pools are listed even when no quota is set. In that case, Current Usage, Quota Type, Start Day, Notifications and When Quota Exceeded are blank and the only action is Configure. Every carrier detected in the group has a row, even if no SIM is counted against it, so a No. of SIMs value of zero is expected. An empty Custom Pools table shows No data available.
11.5.4. Per-SIM Daily Data Usage
This section produces a CSV file, not an on-screen table.

The Per-SIM Daily Data Usage export. IMSI is selected, the identifier box is empty, and Download as CSV is greyed out.
Field | Notes |
SIM Identifier | Select IMSI or ICCID. IMSI is selected by default |
IMSIs | The identifiers to report on. The screen states they may be separated by commas, spaces or carriage returns, and that the wildcard character * is allowed |
Date Range | A From and a to field |
Download as CSV for this section is disabled when no identifiers are entered.
The two Date Range fields are empty by default.
11.5.5. Devices and SIM Cards
The table is grouped by device, with one row per SIM slot.
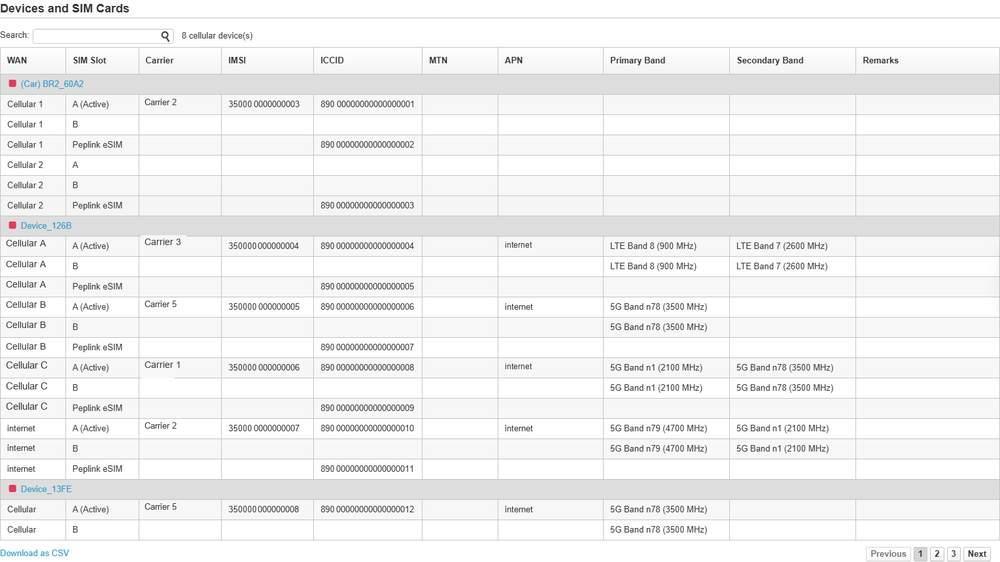
The SIM inventory grouped by device, with A, B and Peplink eSIM rows under each cellular WAN, the (Active) marker on the slot in use, and the paging controls at the bottom.
Column | What it shows |
WAN | The cellular WAN the slot belongs to, for example Cellular 1 |
SIM Slot | The slot, given as A, B or Peplink eSIM. The slot in use is marked (Active) |
Carrier | The carrier the SIM is registered to, with its country |
IMSI | The IMSI of the SIM |
ICCID | The ICCID of the SIM |
MTN | The mobile telephone number recorded for the SIM |
APN | The APN in use |
Primary Band | The primary band reported |
Secondary Band | The secondary band reported |
Remarks | Free text entered for the SIM |
An empty cell means the slot reported no value. A slot without a SIM still has a row, with the identifier columns blank. Hover over the coloured status dot beside a device name to see the device's current status, for example Online or Offline.
Above the table, the screen states how many cellular devices are covered, for example 2 cellular device(s). The table is paged, with Previous, numbered pages and Next below it, and has its own Search: field.
Each cellular WAN has a row for each physical tray, A and B, with the active tray marked (Active), plus a Peplink eSIM row where present. A device can therefore have more rows than physical trays.
11.5.6. Controls on This Screen
Control | What it does |
Search: | Filters the Carrier Pools table |
New SIM Pool | Opens the pool editor described below |
Pool Name, IMSI or Device Name | Filters the Custom Pools table by pool name, IMSI or device name |
IMSI / ICCID | Selects the identifier used for the Per-SIM Daily Data Usage export |
Configure | Opens the settings for a carrier pool row |
Download as CSV | Exports the section above it. Per-SIM Daily Data Usage and Devices and SIM Cards each have their own link |
11.5.7. Creating a Custom SIM Pool
To create a custom SIM pool, enter a pool name, list the SIMs by IMSI or ICCID, set the quota and Start Day, select the alert channels, and select the action to take when the quota is exceeded.
Click New SIM Pool to open the dialog.
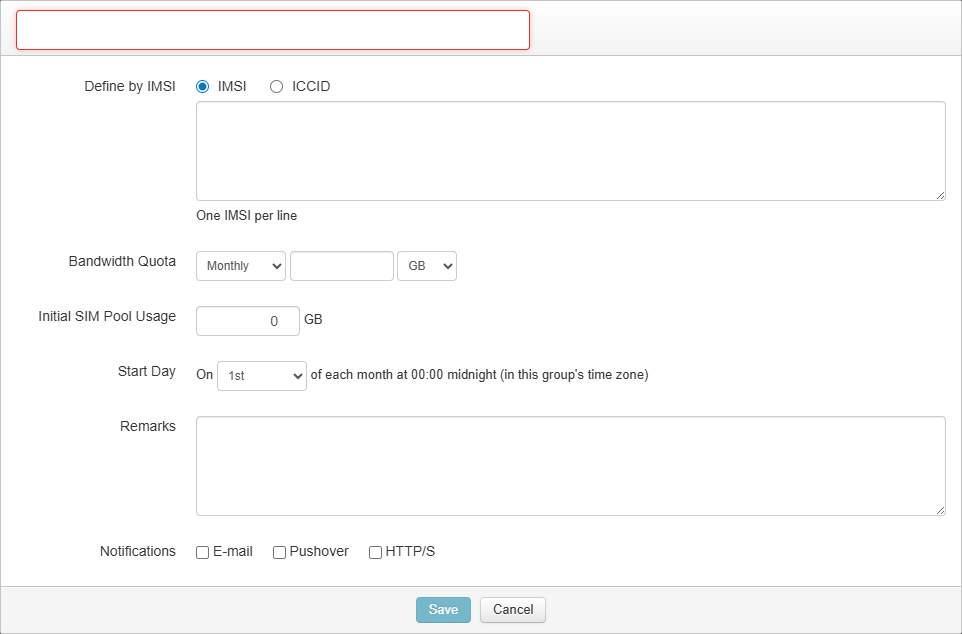
The New SIM Pool dialog. The empty box at the top, outlined in red, is the Pool Name. Start Day runs at 00:00 midnight in the group's time zone.
Field | Notes |
Pool Name | The first box, in the dialog's header. The name entered is shown in the Custom Pools table |
Define by | IMSI or ICCID |
Identifier list | One identifier (IMSI or ICCID) per line |
Bandwidth Quota | Period, amount and unit |
Initial SIM Pool Usage | A starting figure in GB, for a pool that already has usage |
Start Day | The day of the month the quota period restarts |
Remarks | Free text for the pool |
Notifications | E-mail, Pushover, HTTP/S |
When Bandwidth Quota Exceeded | Stop Routing User Traffic, Bandwidth Throttling |
Caution: Stop Routing User Traffic stops user traffic once the pool's quota is exceeded, and one pool can hold SIMs across many devices. Check the SIMs in the pool and the quota before saving. Select Bandwidth Throttling where loss of service is not acceptable.
The dialog's dropdowns offer:
Dropdown | Options |
Bandwidth Quota period | Daily, Weekly, Monthly, Yearly |
Bandwidth Quota unit | MB, GB, TB |
Start Day | 1st through 28th, and Last day |
The Start Day list offers the 1st through the 28th, and Last day. The quota period starts at 00:00 midnight on the selected day, in the group's time zone. For a period that follows the calendar month, from the 1st to the end of the month, select 1st. Last day starts at 00:00 on the last day of each month, for a billing cycle that starts on that day.
The dialog states that the quota restarts of each month at 00:00 midnight (in this group's time zone). The reset time follows the group's time zone, not the user's.
Subject for Usage Alerts sets the subject line of the usage alert. The field accepts the following variables, listed in the dialog:
- ${date_time}
- ${group_name}
- ${link}
- ${n_sims}
- ${organization_name}
- ${quota}
- ${quota_mb}
- ${start_day}
- ${start_weekday}
- ${start_month}
- ${pool_name}
- ${usage}
- ${usage_mb}
- ${usage_percentage}
HTTP/S posts the alert to a specified URL. A test action beside the field reports Sent or Failed. The dialog describes the behaviour as follows:
- An HTTP/S POST call is made to the specified URL for the events selected above.
- The POST data is an array of events in JSON format. Each event includes fields such as ts, device_name, device_id, client_name, client_mac, event_type, detail, longitude, latitude, gps_timestamp and sn.
- On any error, for example an HTTP response code of 300 or above or a network timeout, the call is retried "at most five times every one minute".
HTTP/S can post quota alerts to an external system, such as a chat or issue tracking system. The payload includes device_name, sn, event_type and detail, which identify the device concerned.
Save and Cancel close the dialog.
11.5.8. Reset Time Differs Between Levels
SIM pools also exist at organization level. The two levels reset at different times.
Level | Quota resets at |
Group | Midnight in that group's time zone |
Organization | Midnight GMT+0 |
A group pool and an organization pool can therefore show different figures around a day boundary, even when they hold the same SIMs, because their days start at different times. See the Organization Reports chapter for the organization-level screen (4.1 SIM Card Reports (Organization Level)).
11.6. Starlink Data Pools (Group Level)
Applies pooled data quotas to Starlinks attached to devices in the group, and lists those Starlinks.
Where to find it
Group > Reports > Starlink Data Pools
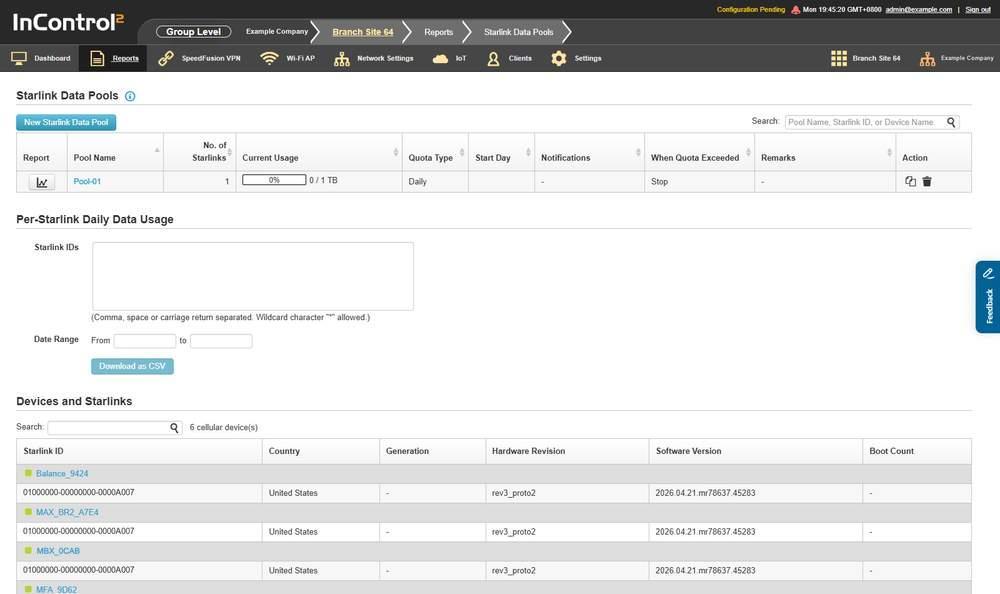
The Starlink Data Pools screen with one pool defined. The Devices and Starlinks table at the bottom lists the Starlinks available to pool.
11.6.1. What a Starlink Data Pool Is
The Starlink Data Pools heading has an information icon. Its tooltip states that:
- A Starlink data pool profile tracks the overall data usage of a group of Starlinks during billing cycles.
- Each Starlink is identified by its Starlink ID.
- A Starlink ID can be associated with one or more data pools.
11.6.2. What This Screen Shows
Section | What it shows |
Starlink Data Pools | The user-defined pools |
Per-Starlink Daily Data Usage | A CSV export of daily usage for selected Starlinks |
Devices and Starlinks | The Starlink inventory per device |
11.6.3. The Pool Table

One pool row. Current Usage is shown as a bar with the percentage inside it and the amount used against the quota beside it. The Action column has two icons.
Column | What it shows |
Report | An icon linking to the pool's usage report |
Pool Name | The pool name |
No. of Starlinks | Number of Starlinks counted in the pool |
Current Usage | Data used in the current quota period, shown as a bar with the percentage used, and the amount used against the quota beside it |
Quota Type | The quota period set for the pool, for example Daily |
Start Day | The day of the month the quota period starts. Blank if no start day is set |
Notifications | Notification channels enabled for the pool. A dash if none |
When Quota Exceeded | The action taken once the quota is exceeded, shown in short form as Stop |
Remarks | Free text for the pool. A dash if none |
Action | Two icons: Clone and delete |
Every column except Report and Action is sortable. With no pools defined, the table shows No data available.
11.6.4. Per-Starlink Daily Data Usage

The Per-Starlink Daily Data Usage export. Enter the Starlink IDs and the From and to dates, then click Download as CSV.
Field | Notes |
Starlink IDs | The Starlinks to report on. The screen states they may be separated by commas, spaces or carriage returns, and that the wildcard character * is allowed |
Date Range | A From and a to field |
Download as CSV for this section is disabled when no identifiers are entered.
The Date Range fields work as on SIM Card Reports (11.5 SIM Card Reports (Group Level)).
11.6.5. Devices and Starlinks
The table is grouped by device, with one row per Starlink.
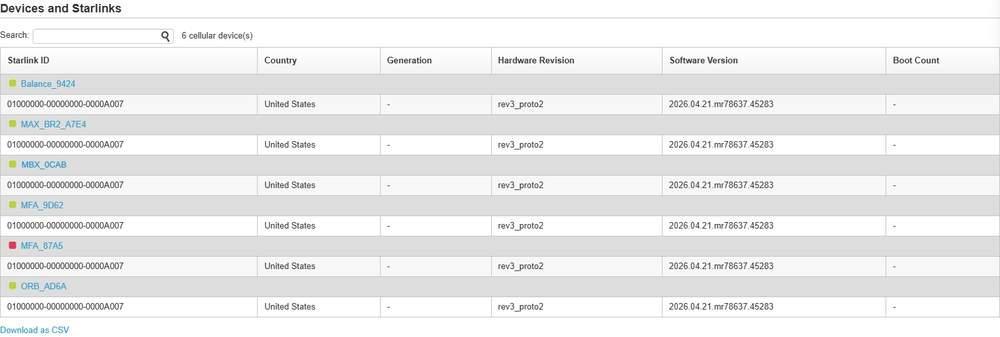
The Starlink inventory. Each device has a grey heading row with its status square, and its Starlinks are listed below it. Search is above the table.
Column | What it shows |
Starlink ID | The Starlink identifier |
Country | The country reported by the Starlink |
Generation | The generation value reported by the Starlink |
Hardware Revision | The hardware revision string reported by the Starlink |
Software Version | The software version running on the Starlink |
Boot Count | The number of boots reported by the Starlink |
The same Starlink ID can appear under more than one device if the Starlink has been connected to each. Each row shows the values that device last reported.
Generation and Boot Count are not always reported. A dash in either column means the Starlink sent no value, not that the value is zero.
11.6.6. Controls on This Screen
Control | What it does |
New Starlink Data Pool | Opens the pool form described below |
Pool Name, Starlink ID, or Device Name | Filters the pool table by pool name, Starlink ID or device name |
Search: | Filters the Devices and Starlinks table |
Download as CSV | Exports the section above it. Per-Starlink Daily Data Usage and Devices and Starlinks each have their own link |
11.6.7. Creating a Starlink Data Pool
New Starlink Data Pool opens a form with the same layout as the SIM pool editor.
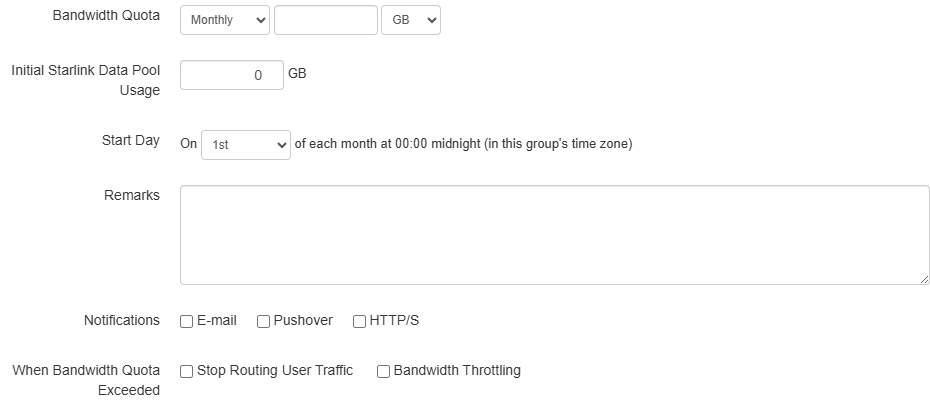
The quota part of the form. The Start Day wording ties the reset to this group's time zone. When Bandwidth Quota Exceeded has two options.
Field | Notes |
Pool Name | The name shown in the pool table |
Starlink IDs | One ID per line |
Bandwidth Quota | Period, amount and unit |
Initial Starlink Data Pool Usage | A starting figure, for a pool that already has usage |
Start Day | The day of the month the quota period restarts |
Remarks | Free text for the pool |
Notifications | E-mail, Pushover, HTTP/S |
When Bandwidth Quota Exceeded | Stop Routing User Traffic, Bandwidth Throttling |
Caution: Stop Routing User Traffic stops user traffic once the pool's quota is exceeded, and one pool can hold Starlinks attached to many devices. Check the Starlink IDs in the pool and the quota before saving. Select Bandwidth Throttling where loss of service is not acceptable.
Dropdown | Options |
Bandwidth Quota period | Daily, Weekly, Monthly, Yearly |
Bandwidth Quota unit | MB, GB, TB |
Start Day | 1st through 28th, and Last day |
As with SIM pools, the form states that the quota restarts of each month at 00:00 midnight (in this group's time zone).
The notification settings work as on the SIM pool dialog, with one difference in the variable list:
- Subject for Usage Alerts accepts ${date_time}, ${group_name}, ${link}, ${n_starlinks}, ${organization_name}, ${quota}, ${quota_mb}, ${start_day}, ${start_weekday}, ${start_month}, ${pool_name}, ${usage}, ${usage_mb} and ${usage_percentage}. The count variable is ${n_starlinks}, not ${n_sims}.
- HTTP/S posts an array of events in JSON format to a specified URL, with a test action that reports Sent or Failed. On any error, for example an HTTP response code of 300 or above or a network timeout, the call is retried "at most five times every one minute".
Save is unavailable until the required fields are filled in. Cancel closes the form.
11.7. Starlink Reports
Charts the performance of one Starlink over a time window. This screen is available at group level only. For pooled data allowances across the group's Starlinks, see Starlink Data Pools (group level) (11.6 Starlink Data Pools (Group Level)).
Where to find it
Group > Reports > Starlink Reports
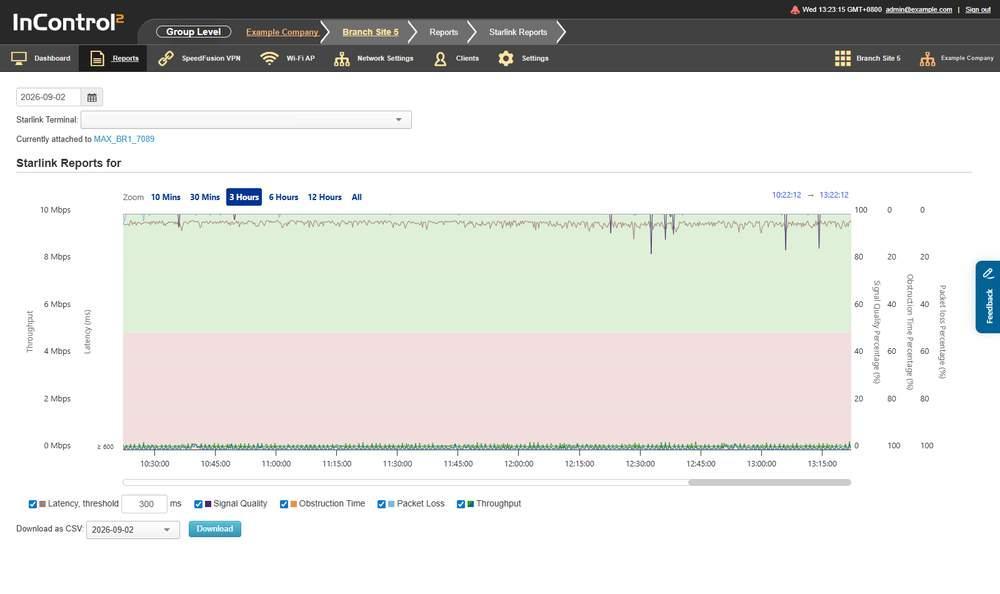
Starlink Reports. The Starlink selector is at the top, the series checkboxes below it, and the charts below those. The heading shows the Starlink currently charted.
11.7.1. Choosing a Starlink
The screen reports on one Starlink at a time, selected from the Starlink Terminal: list at the top. The list defaults to Please Select.... Each entry shows the Starlink identifier followed by its service line reference, in the form utXXXXXXXX-XXXXXXXX-XXXXXXXX, AST-XXXXXXX-XXXXX-XX. The Starlink identifier (ut...), the first part of each entry, identifies the Starlink. The service line reference is a separate value.
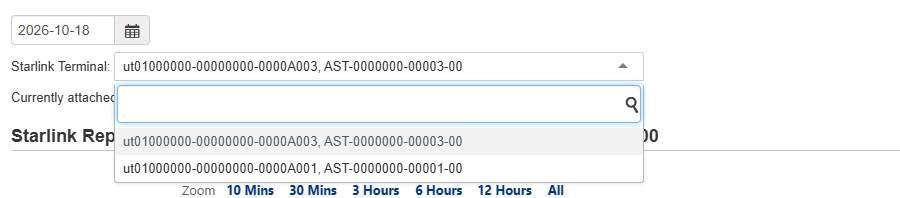
The Starlink Terminal list opened. Each entry shows a Starlink identifier and its service line reference. A search box is at the top of the list.
Below the selector, InControl 2 shows the device the Starlink is attached to, as Currently attached to <device name>. The heading above the charts shows the selected Starlink.
11.7.2. The Series
Five series are available, each with its own checkbox. All five are selected by default.
Series | What it charts |
Latency | Round trip latency in milliseconds. Has its own threshold field, in ms |
Throughput | Data rate. Its information icon reads Data source: Per-minute Reports |
Signal Quality | Signal quality as a percentage |
Obstruction Time | Proportion of time the Starlink was obstructed, as a percentage |
Packet Loss | Packet loss |
Clear a series checkbox to remove it from the charts.
To distinguish an obstruction problem from a service problem, chart Obstruction Time together with Packet Loss and Latency for the outage period. Packet loss that rises with obstruction indicates a Starlink placement issue. Two related settings are in Settings (Group Level):
- Ignore Starlink Outage in the Actions menu at Group > Settings > Device Management, which keeps Starlink WANs connected even when the Starlinks detect obstructions. See 13.1.7 What Each Entry Opens.
- Stowing Starlinks by location under Geo-fencing. See 13.11.6 Stowing Starlinks by Location.
11.7.3. The Time Window
Control | What it does |
Date | The day being charted |
Start and end time | Two time fields that set the window within that day. They default to the last three hours |
Month | A month list, offering the current month and the four before it |
Download | Exports the report |
11.8. Captive Portal Dashboard
Shows current captive portal activity for the group, including the clients the portal recognises. For portal activity over a period, use Group > Reports > Captive Portal Reports (11.9 Captive Portal Reports (Group Level)).
Where to find it
Group > Reports > Captive Portal Dashboard
11.8.1. What This Screen Shows
Section | What it shows |
Usage of Today | Portal usage so far today |
Refresh: On Off | A client table with its own refresh control |
Usage of the last 7 days | Portal usage over the past seven days |
The two usage panels cover fixed periods, and the screen has no date range selector. The dashboard reports only clients currently recognised by the portal. If there are none, Usage of Today, the client table and Usage of the last 7 days all show No data available. An empty dashboard does not indicate that the portal is misconfigured.
If the group's captive portals use tokens or guest accounts, one tile per portal is also shown below Usage of Today.
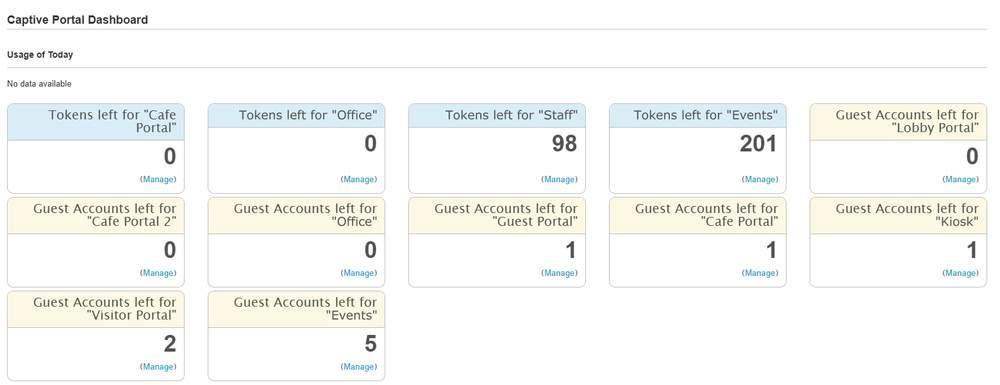
A group with several portals. Blue tiles show the tokens left for a portal and yellow tiles the guest accounts left, each with a Manage link.
Tile | What it shows |
Tokens left for "<portal>" | The number of tokens still available for that portal |
Guest Accounts left for "<portal>" | The number of guest accounts still available for that portal |
Each tile has a Manage link.
The client table has the following columns.
Column | What it shows |
Type | The client type |
Name | The client name |
IP Address | The address held by the client |
Kind | The client kind |
Manufacturer | Manufacturer identified for the client device |
Access Mode | The portal access mode the client used |
Action | Per row actions |
11.8.2. Controls on This Screen

The Refresh switch set to On above the client table, with Search beside the entry count and Download as CSV below. With no portal clients, the table reads No data available.
Control | What it does |
Refresh: On Off | Turns automatic refreshing of the client table on or off |
Search: | Filters the client table |
Download as CSV | Exports the client table |
11.9. Captive Portal Reports (Group Level)
Reports captive portal access and guest activity over a selected period, and exports the guest user information collected by the portal. This screen covers the whole group. The device-level version, Device > Reports > Captive Portal Reports (15.8 Captive Portal Reports (Device Level)), covers one device. At device level, the device running the portal shows the same data as this screen, and the other devices in the group show No data available. Use this screen for portal reporting across the whole group.
Where to find it
Group > Reports > Captive Portal Reports
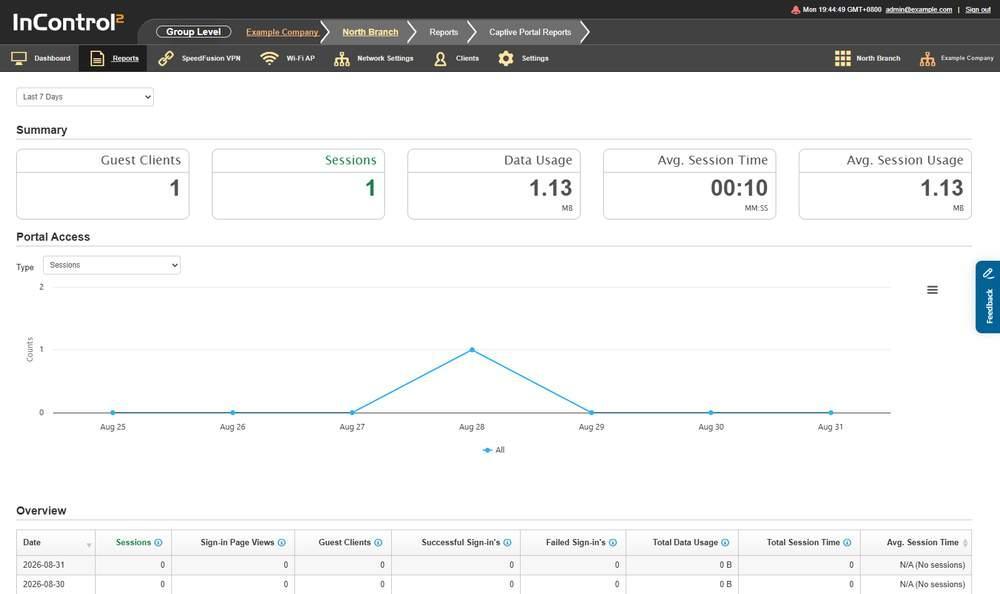
Captive Portal Reports for a group with portal activity. The five Summary tiles are at the top of the page. The Portal Access chart below them has its own Type dropdown.
11.9.1. What This Screen Shows
The page is a stack of six sections.
Section | What it covers |
Summary | Five tiles giving the headline portal figures for the period |
Portal Access | One measure of portal access plotted per day, selected from a Type dropdown |
Overview | A table of every measure, one row per day |
Client Types | The operating systems of the clients that used the portal, as a table and a pie |
Visits in Each Access Mode | One measure per day, split by the access mode used |
Guest User Information Download | An export of the guest user details the portal collected |
11.9.2. Summary
Tile | What it reports |
Guest Clients | Guest clients in the period |
Sessions | Portal sessions in the period |
Data Usage | Data passed by portal clients, with the unit below the figure |
Avg. Session Time | Mean session length, labelled MM:SS |
Avg. Session Usage | Mean data per session, with the unit below the figure |
Sessions counts new sessions only. The tile's information icon states that since InControl 2.8 this value counts new sessions, and that signing in on an existing session is not counted. A guest who reconnects within an existing session does not increase the figure.
11.9.3. Portal Access
A Type dropdown selects the measure the chart plots. It offers eight options, which are also the columns of the Overview table:
- Sessions
- Sign-in Page Views
- Guest Clients
- Successful Sign-in's
- Failed Sign-in's
- Total Data Usage
- Total Session Time
- Avg. Session Time
Sessions is selected by default. The chart plots the selected measure per day, with Counts on the vertical axis and a single All series.
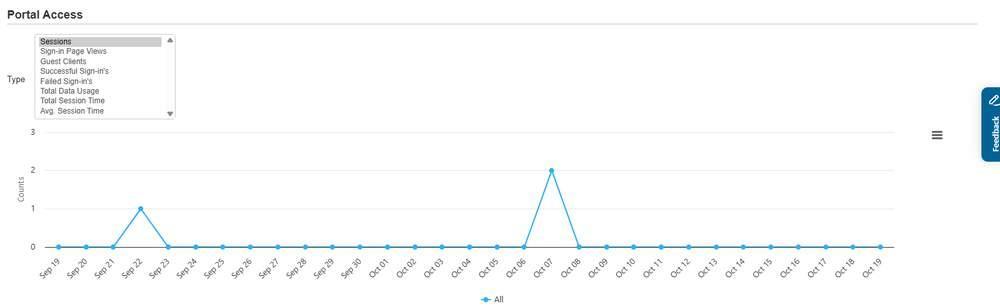
The Type list expanded to show its eight options, with Sessions selected, above the chart of daily counts.
11.9.4. Overview
One row per day in the period, newest first.

The Overview table, newest day first. Days with no portal activity show zero and N/A (No sessions). Days with activity show each measure.
Column | What it shows |
Date | The day the row covers |
Sessions | Sessions started that day |
Sign-in Page Views | Views of the sign-in page |
Guest Clients | Distinct guest clients |
Successful Sign-in's | Sign-ins that succeeded |
Failed Sign-in's | Sign-ins that failed |
Total Data Usage | Data passed that day |
Total Session Time | Session time accumulated that day |
Avg. Session Time | Mean session length that day |
A day with no portal activity is still listed, with zeros across the row and N/A (No sessions) in Avg. Session Time. Several column headings have information icons. A group with no portal traffic in the selected period shows No data available in every section, including Overview. A wider date range may show earlier activity.
11.9.5. Client Types

The Client Types table. In this example every portal client runs iOS, so one row shows 100%.
Column | What it shows |
System | The operating system identified for the clients, for example iOS |
Clients | Number of clients running it |
Percentage | That system's share of the clients |
The same data is shown as a pie chart beside the table.
11.9.6. Visits in Each Access Mode
A second Type dropdown, with the same eight options as Portal Access, sets the measure. The table shows one row per day and one column per access mode in use. If all portals in the group use a single mode, the table shows one column, headed All.
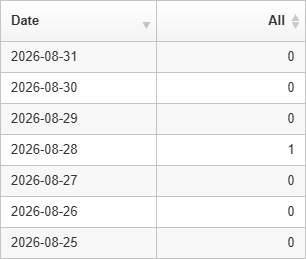
The access mode table for a group using a single mode. The only column after Date is headed All.
11.9.7. Controls on This Screen
Control | What it does |
Date range selector | Sets the period reported on the page |
Type (Portal Access) | Selects the measure the Portal Access chart plots |
Type (Visits in Each Access Mode) | Selects the measure the access mode table reports |
Download as CSV | Exports the section above it. Overview, Client Types, Visits in Each Access Mode and Guest User Information Download each have their own link. Summary and Portal Access have none. The data behind the chart can be exported from Overview, which holds every measure for the same days |
The date range selector on this screen offers five options:
- Today
- Yesterday
- Last 7 Days
- Last 31 Days
- Custom
Custom works as on Device Reports (11.2.8 The Custom Range).
The longest fixed period on this screen is Last 31 Days. With Custom, the earliest selectable date is about 92 days back.
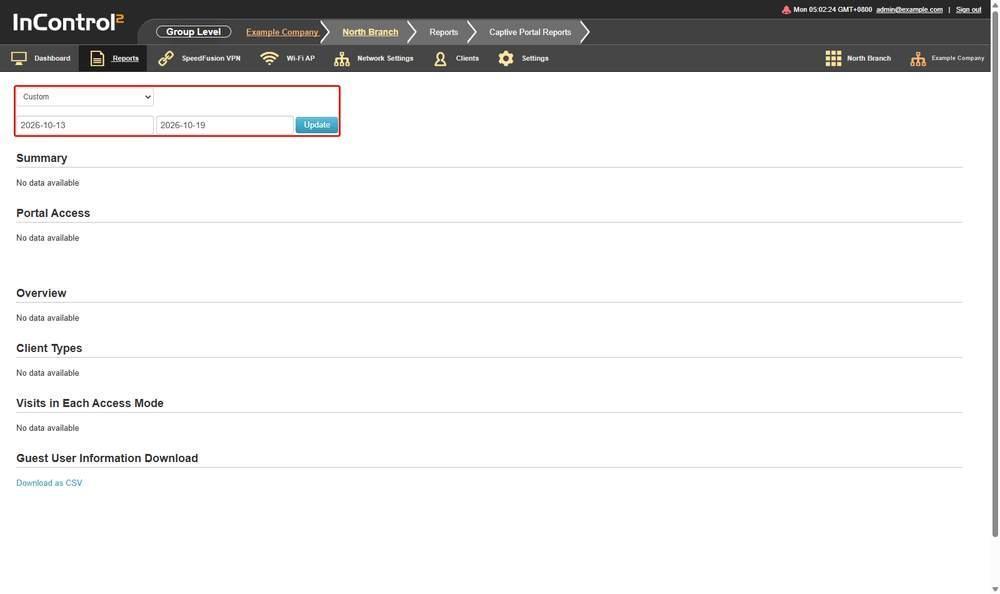
Captive Portal Reports with Custom selected. The selector, the two date fields and Update are outlined in red, above Summary. The sections below show data when the portal has recorded activity in the selected period.
11.10. Connection Test Reports
Reports the results of connection tests run by devices in the group for a selected day, week or month.
Where to find it
Group > Reports > Connection Test Reports
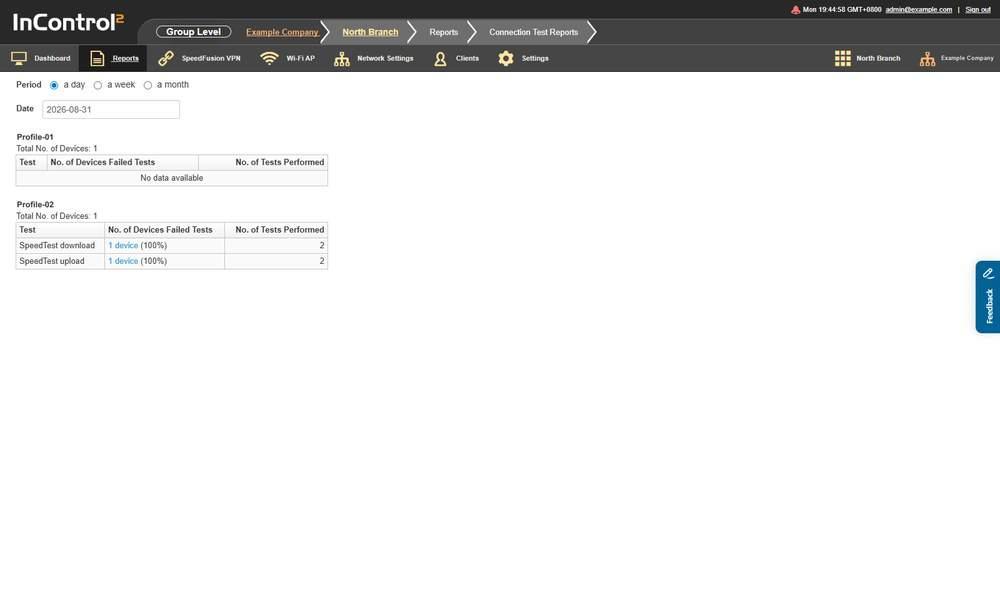
Connection Test Reports with results. Each connection test profile in the group has its own table, headed by the profile name and the number of devices it covers.
11.10.1. What This Screen Shows
One table per connection test profile defined for the group. Each table is headed by the profile name, with Total No. of Devices above it, and has one row per test type the profile runs.

One profile's results. Each test type has a row. The failed device count is a link, with its share of the profile's devices in brackets.
Column | What it shows |
Test | The test that ran, for example SpeedTest download or SpeedTest upload |
No. of Devices Failed Tests | How many devices failed that test, with their share of the profile's devices in brackets. It counts devices, not failures. A device that failed the same test on several runs counts once. The figure is a link |
No. of Tests Performed | How many times the test ran in the period. Every run is counted |
The report is per profile and per test, not per device. It shows how many devices failed. To identify the devices, search the Event Log, where Connection Test is one of the event categories. See 11.11.2 Search and Filter.
A table with no results for the selected period shows No data available instead of rows.
Connection test profiles are defined at Group > Network Settings > Connection Tests. See 8.16 Connection Tests.
11.10.2. Controls on This Screen

The Period options, with a day selected, and the Date field showing the day the report is based on.
Control | What it does |
a day / a week / a month | Sets the Period the report covers. a day is selected by default |
Date | Sets the day the period is based on. A text field showing the current date, in the format YYYY-MM-DD |
This screen can be e-mailed on a fixed schedule from Group > Settings > Report E-mailing (13.8 Report E-mailing (Group Level)).
11.11. Event Log (Group Level)
Searches events raised by the devices in the group, filtered by device tag, time range, free text and event category. Use it to find what happened, on which device and when.
Where to find it
Group > Reports > Event Log
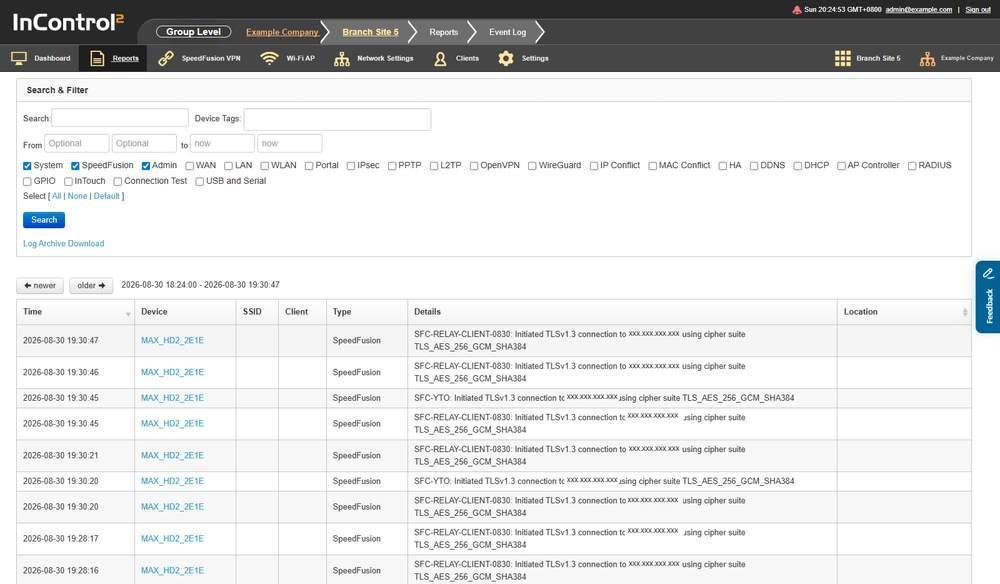
The Event Log screen. The Search and Filter panel is above the results. The newer and older buttons page through the matching events.
11.11.1. What This Screen Shows
Results appear below the Search & Filter panel, with the time range of the current page shown above the table.
Column | What it shows |
Time | When the event was raised |
Device | The device that raised it. The name links to the device |
SSID | The SSID involved, where the event relates to one |
Client | The client involved, where the event relates to one |
Type | The event category, for example SpeedFusion |
Details | The event text as the device reported it |
Location | The coordinates recorded for the device at that time, as a link. For a mobile device, this shows where the device was when each event was raised, for example where a vehicle was when a WAN dropped |
11.11.2. Search and Filter

The Search & Filter panel. System, SpeedFusion and Admin are selected, the From fields read Optional and the to fields read now. Select All, None or Default is below the checkboxes.
Field | What it does |
Search: | Free text match against the events. The field is marked Optional |
Device Tags: | Limits results to devices with a selected tag |
From / to | Limits results to a time range. The to field defaults to now |
Category checkboxes | Limit results to selected event categories |
The Device Tags dropdown lists the tags defined for the group.
Twenty three category checkboxes are available:
- System
- SpeedFusion
- Admin
- WAN
- LAN
- WLAN
- Portal
- IPsec
- PPTP
- L2TP
- OpenVPN
- WireGuard
- IP Conflict
- MAC Conflict
- HA
- DDNS
- DHCP
- AP Controller
- RADIUS
- GPIO
- InTouch
- Connection Test
- USB and Serial
Below the checkboxes, Select [ All | None | Default ] selects all categories, clears them, or restores the default selection in one action.
11.11.3. How to Reconstruct an Outage
- 1.Set From to a few minutes before the start of the outage.
- 2.Select WAN as well as System and SpeedFusion. By default, only System, SpeedFusion and Admin are selected, so WAN events are hidden until WAN is selected.

Step 1 and step 2. The From fields and the WAN checkbox, outlined in red. System, SpeedFusion and Admin are the three categories selected by default.
- 3.Limit the results to the affected site: select its tag in Device Tags:, or enter the device name in Search:.
- 4.Click Search, then use older and newer to page through results.
- 5.For an event older than 31 days, use Log Archive Download instead.
11.11.4. Controls on This Screen
Control | What it does |
Search | Runs the search with the filters set above |
Select [ All | None | Default ] | Selects all categories, clears them, or restores the default selection |
Log Archive Download | Retrieves an archive of the log, which covers a much longer period than a search |
newer | Pages to more recent events |
older | Pages to older events |
Download as CSV | Exports matching events. The export is capped, see below |
The newer and older buttons appear both above and below the results table.
11.11.5. The CSV Export Is Capped
Download as CSV does not export every event a search matches. The link's tooltip states the limit.
- The download is limited to 1000 events in the last 7 days of the specified time period.
- A search covering several weeks exports only the last 7 days of that range, and only the first 1000 events within it.
- To export a complete set, narrow the time range or filter by category or device tag, and export in batches.
11.11.6. The Log Archive Download Dialog
Log Archive Download opens a dialog. It does not start a download directly.
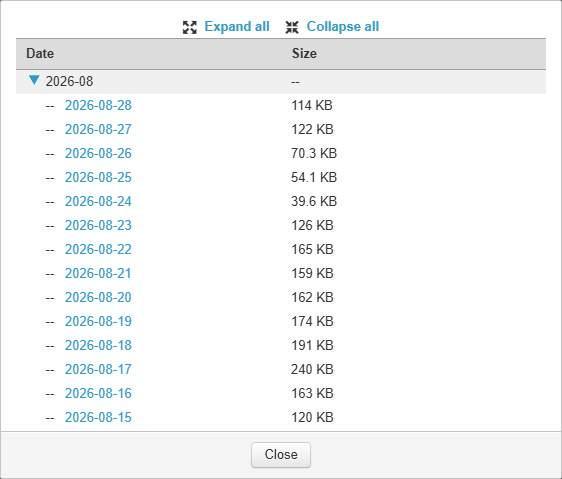
The Log Archive Download dialog. Months are collapsible rows, the days inside the expanded month are the download links, and Close closes the dialog.
Control | What it does |
Expand all | Opens every month in the list |
Collapse all | Closes every month in the list |
Date | One row per month, expandable to the days inside it. Each day is a link that retrieves that day's archive |
Size | The size of that day's archive. Month rows show a dash |
Close | Closes the dialog |
- The archive is per day, not per month. A month row groups the days, and each day is a separate download.
- The current month is expanded by default. Earlier months are collapsed.
- The list covers 24 months back from the current month. The oldest month is removed as a new one is added.
- The most recent days are not yet listed, because the archive is about 3 days behind. Use Search for those days.
11.11.7. How Far Back the Log Reaches
Event Log search and Log Archive Download cover different periods.
Mechanism | How far back it reaches |
Event Log search | A rolling 31 days |
Log Archive Download | A rolling 24 months |
- Events older than 31 days cannot be found with Search, regardless of the filters. Use Log Archive Download instead.
- The dialog lists the current month and the 24 months before it.
- The most recent days are not yet available as an archive, which is typically about 3 days behind the present (11.11.6 The Log Archive Download Dialog).
- There is no retention setting in Organization Settings. Both periods are fixed and cannot be extended.
- These periods apply to the Event Log only. The usage and captive portal report screens have their own periods.
11.12. Tags
Lists the device tags defined for the group and shows which configurations use each one. These are the same tags used elsewhere in the interface to target devices, including the Device Tags: filter on the Event Log screen (11.11.2 Search and Filter) and the By tags device selection on Usage Reports (11.4.1 Report Parameters). Use this screen to see which tags exist and which configurations depend on them before changing a tag. Only the tag description can be edited here. The screen has no option to create, rename or delete a tag.
Where to find it
Group > Reports > Tags
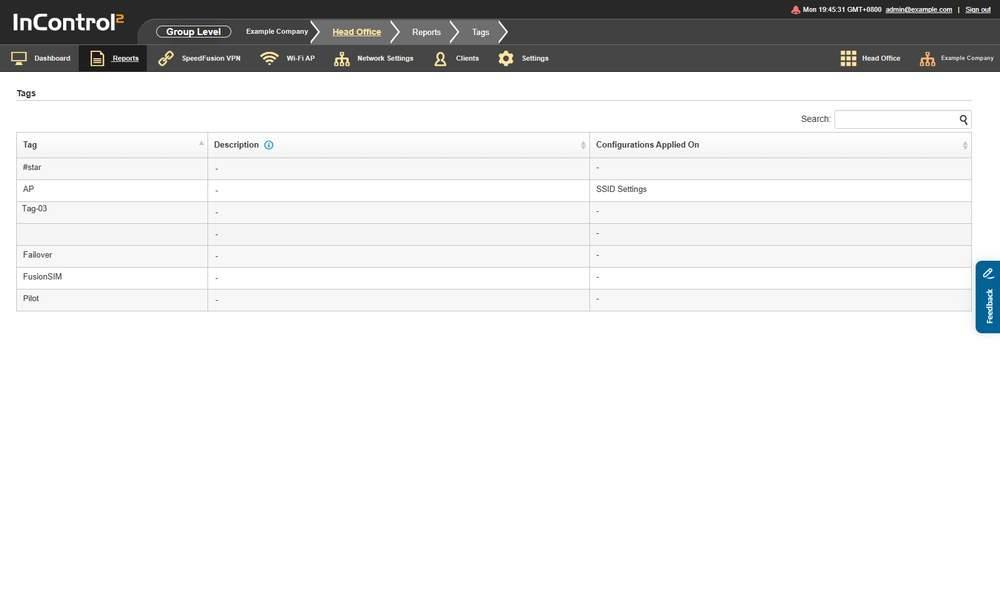
The Tags screen. The Configurations Applied On column shows which settings depend on each tag.
11.12.1. What This Screen Shows
Column | What it shows |
Tag | The tag name |
Description | The tag description. A dash if none |
Configurations Applied On | The configurations that target devices by this tag, for example SSID Settings or External InControl Appliance Settings. A dash if no configuration uses the tag. Check this column before changing how a tag is used |
Tags are listed alphabetically. A tag name that starts with a symbol is sorted before the letters.
11.12.2. Controls on This Screen
Control | What it does |
Search: | Filters the tag list |
Description cell | Click to open an inline text box with Save and Cancel for editing the tag description. Cancel leaves the description unchanged |
Caution: Tag descriptions are shared across the organization. A description belongs to the tag, not to this group. A saved description applies across the whole organization and is visible in every other group that has the same tag defined.