
10. Group Dashboard
The Group Dashboard is the first screen of a group. It has a single screen, Dashboard, which lists every device in the group with its status and current readings, plots the devices on a map, lists the group's InTouch profiles and shows a live event log. All content is scoped to the selected group.
10.1. Dashboard
The Dashboard shows the devices in the group, their locations, their InTouch profiles and their current events. It is the starting point for a daily health check and for outage troubleshooting. The device counts cover the selected group. The organization-wide counts are on Organization > Overview (3.1.2 Organization Summary).
Where to find it
Group > Dashboard
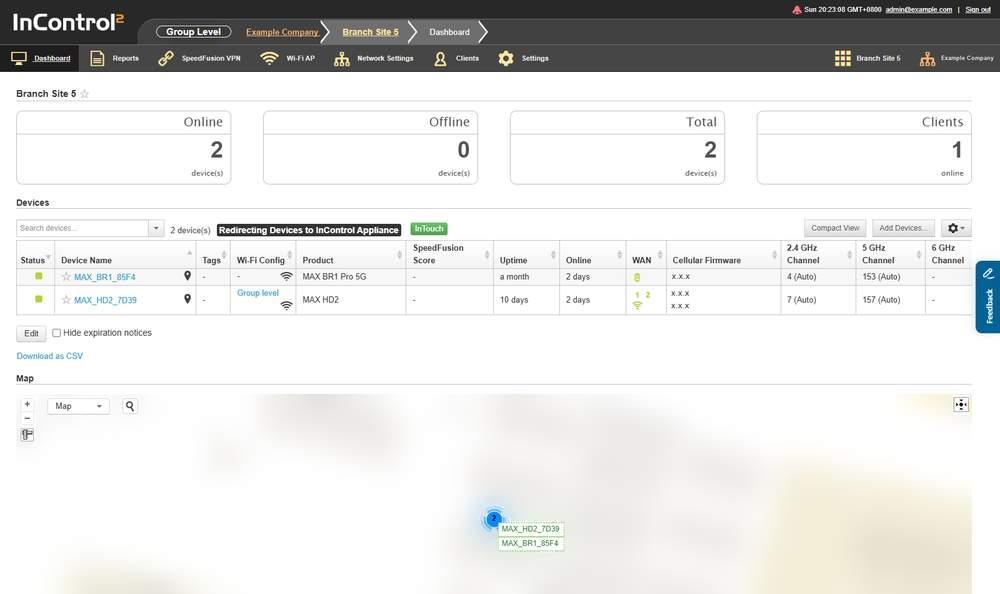
The Dashboard. The device summary is at the top, the Devices grid below it, then the Map, InTouch and Event Log panels.
10.1.1. Daily Health Check
Check the screen in this order. Each step names the row icon by its tooltip text.
- 1.Check Offline in the group summary. Investigate these devices first if the count is above zero.

Step 1. The Offline tile, outlined in red, counts the devices in this group that are currently offline.
- 2.Look for Priority-1 down WANs: one or more of the device's priority 1 WANs are down.
- 3.Look for One or more WANs hit 100% usage and restricted to routing management traffic only.: that WAN carries management traffic only, and user traffic is no longer routed over it.
- 4.Look for the four configuration state icons: Config patches available, InControl stopped to apply configurations to device., Configuration to device stopped. Configuration rolled back. and Device disabled configurations from InControl. These devices are not applying the group's configuration.
- 5.Look for Invalid license and Device's web admin password remains with the default one.
- 6.For several groups at once, start from Organization > Overview. Its Groups grid gives Offline Devices per group. See 3.1.3 The Groups Grid.
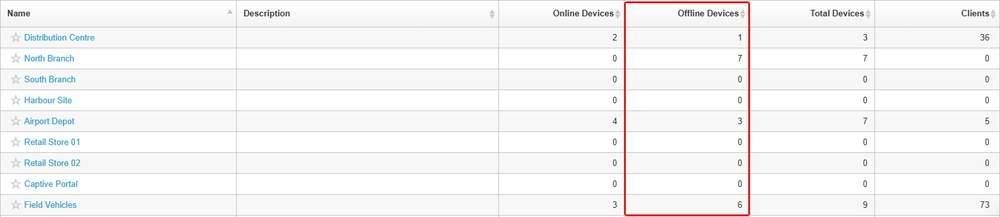
Step 6. The Offline Devices column, outlined in red, on the Groups grid of Organization Overview. Each group name links to that group.
To list only the devices with a given icon, use the search options beside Search devices... on Group > Settings > Device Management, which include the status icon set and Match all. See Status icons in the Settings (Group Level) chapter (13.1.2 Status Icons). For a check across several screens, see Common Tasks (17.3 Daily Health Check).
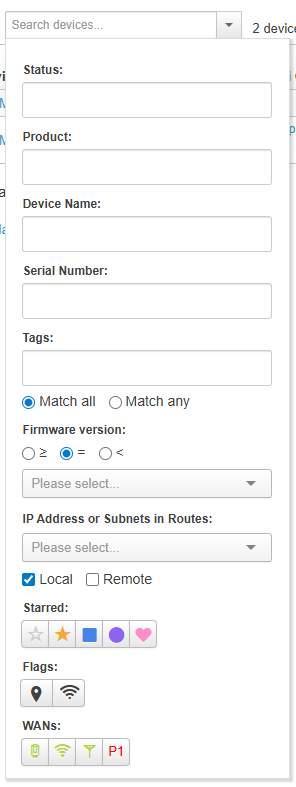
The search options opened beside Search devices... on Group > Settings > Device Management, with Match all and Match any below Tags.
10.1.2. What This Screen Shows

The group summary. Online, Offline and Total count devices, and Clients counts the clients online.
Section | What it shows |
Group summary | Online, Offline and Total device counts for the group, and the number of clients online |
Devices | One row per device in the group |
Map | The group's devices plotted geographically |
InTouch | The InTouch profiles available in the group |
Event Log | The most recent events reported by the group's devices |
The device count is shown above the Devices grid, for example 2 device(s).
Redirecting Devices to InControl Appliance is a badge beside the device count. It indicates that this group's devices are redirected to an InControl Appliance, as set at Group > Settings > Device System Management under Use External InControl Appliance (13.4.9 External InControl Appliance Settings). The same badge appears above the grid on Group > Settings > Device Management.
10.1.3. The Devices Grid
The grid has one row per device. Each device name is a link that opens the device.

The left part of the Devices grid, with the green status squares, the pin icon beside each device name, and Group level in the Wi-Fi Config column.
Column | What it shows |
Status | The device's current status, shown as an icon. Hover over it for the status in words, for example Online |
Device Name | The name given to the device. Links to the device |
Tags | Tags applied to the device |
Wi-Fi Config | The source of the device's Wi-Fi configuration. A device configured at group level shows Group level, which links to the group's SSID configuration |
Product | The product model, for example MAX BR1 Pro 5G |
SpeedFusion Score | The SpeedFusion Score reported for the device. A dash means none is reported |
Uptime | How long the device has been up, shown as a relative time. The tooltip gives the time it came up |
Online | How long the device has been online, shown as a relative time. The tooltip gives the time the current online period began |
WAN | The device's WAN connections |
Cellular Firmware | The cellular module firmware version. A device with two modules lists both |
2.4 GHz Channel | The channel in use, with (Auto) where the channel was selected automatically |
5 GHz Channel | The channel in use, with (Auto) where the channel was selected automatically |
6 GHz Channel | The channel in use, with (Auto) where the channel was selected automatically |
Usage | Current throughput, for example 10.0 kbps |
Clients | Number of clients on the device |
Firmware | The router firmware version, for example 8.6.0 build 6441 |
Last Config Applied | When configuration was last applied to the device, shown as a relative time. The tooltip gives the exact timestamp |
Icons in a device row have their own tooltips. A row shows only the icons that apply to that device, for example With GPS data and Wi-Fi AP enabled. The full set is listed below with the IC2 wording.
Icon tooltip | What it indicates |
With GPS data | The device is reporting GPS data |
Follow another device's GPS location | The device takes its GPS location from another device |
Captive portal enabled | A captive portal is enabled on the device |
Wi-Fi AP enabled | Wi-Fi AP is enabled on the device |
Router mode | The device is in router mode |
Scheduled reboot | A reboot is scheduled for the device |
eSIM Pooled Plan | The device is on an eSIM pooled plan |
Cellular WAN connections are locked to specific SIM cards. | Each of the device's cellular WANs is tied to a particular SIM card |
One or more WANs hit 100% usage and restricted to routing management traffic only. | A WAN has used its full allowance and now carries management traffic only. Requires action |
Priority-1 down WANs | One or more priority 1 WANs are down. Open the device's Connection Up/Down History (15.12 Connection Up/Down History) to see when the WAN dropped, and WAN Quality Reports (15.6 WAN Quality Reports) for its latency before the drop. Both are in the Device Reports chapter |
Ethernet | An Ethernet connection |
Wi-Fi | A Wi-Fi connection |
Cellular | A cellular connection |
Device's web admin password remains with the default one. | The device's web admin password is still the default. Requires action |
Invalid license | The device's license is not valid. Requires action |
Firmware upgrade is available. | A firmware upgrade is available for the device |
One or more Starlink terminal connected to this device has firmware pending to install. | A Starlink attached to the device has firmware waiting to install |
Config patches available | Configuration patches are available for the device |
Device disabled configurations from InControl | The device has turned off configuration from InControl 2 |
InControl stopped to apply configurations to device. | InControl 2 has stopped applying configuration to the device |
Configuration to device stopped. Configuration rolled back. | Configuration was stopped and the device's configuration was rolled back |
Availability figures are added to the Devices grid by Display Internet & Device Availability on Group Dashboard, under Advanced Settings in Settings (Organization Level) (9.8.4 Advanced Settings). Each group can override it under Advanced Settings at Group > Settings > Group Settings (13.17.4 Advanced Settings), with Yes, No or Follow Organization's. The figures are defined under How availability is calculated in the Reports chapter (11.2.3 How Availability Is Calculated).
For the SIM, carrier and band in use per cellular WAN across the group, see Devices and SIM Cards under SIM Card Reports in the Reports chapter (Primary Band, Secondary Band). See 11.5.5 Devices and SIM Cards. For latency over time per WAN, see WAN Quality Reports in the Device Reports chapter (15.6 WAN Quality Reports).
If a device fails shortly after its Last Config Applied time, open Group > Settings > Operation Log to see which administrator changed which setting, with the old and new values. See Operation Log in the Settings (Group Level) chapter (13.18 Operation Log (Group Level)).
Notes on three columns:
- SpeedFusion Score shows a dash for a device with no score to report. The score is reported per device at Device > Reports > SpeedFusion Score, which gives the figure, a rating and the range for each rating, from Critical below 50 to Excellent at 251 and above. See 15.1 SpeedFusion Score in the Device Reports chapter.
- Online is a duration, not a last seen time. It counts how long the device has been online, and its tooltip gives the start of that period. It is separate from Uptime, which counts from when the device came up.
- Uptime and Online together distinguish a restart from a loss of connectivity. A short Uptime means the device came up recently, for example after a reboot or a power loss. A long Uptime with a short Online means the device kept running but lost contact with InControl 2 and then recovered, which indicates a connection issue rather than a device issue. Hover over either value for the exact timestamp, then search the Event Log from that time.
10.1.4. Compact View
Compact View changes the density of the Devices grid, not its content. It is a display setting and makes no change on the devices.
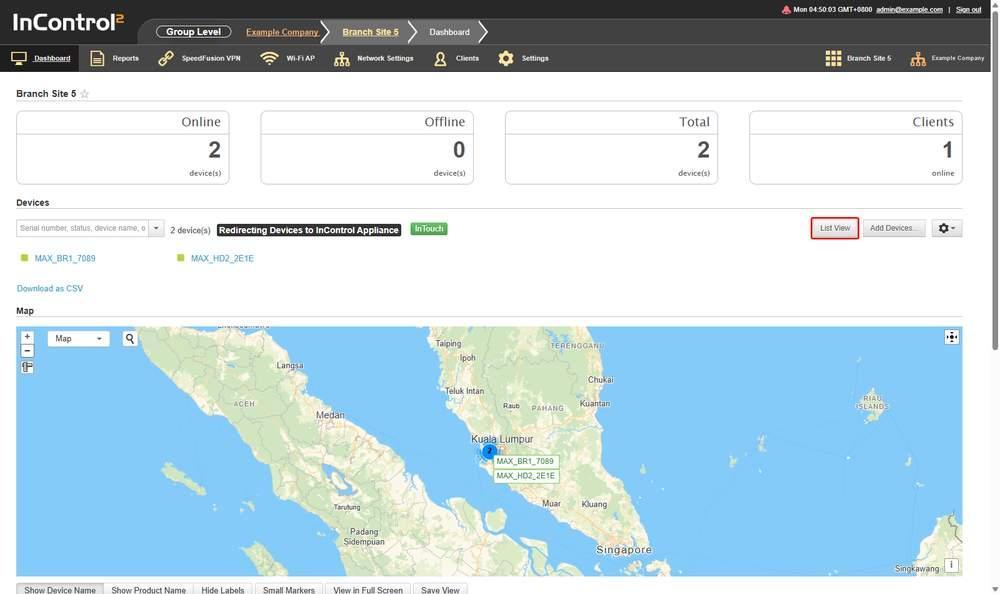
Compact View reduces the grid to device names, each with a status square. The button changes to List View, outlined in red.
In this view | What changes |
The grid | All columns are removed. Each device is shown as one entry, its name beside a status square |
The button | Compact View changes to List View, which restores the full grid |
The search box | Accepts a serial number, status, device name or product name, as its placeholder states |
Edit and Hide expiration notices | Both are hidden while the compact list is shown |
Download as CSV | Remains available |
The map, the InTouch panel and the Event Log panel are not affected.
10.1.5. Adding Devices
Add Devices... opens the Group > Settings > Add Devices page, titled Add Devices Into Groups.
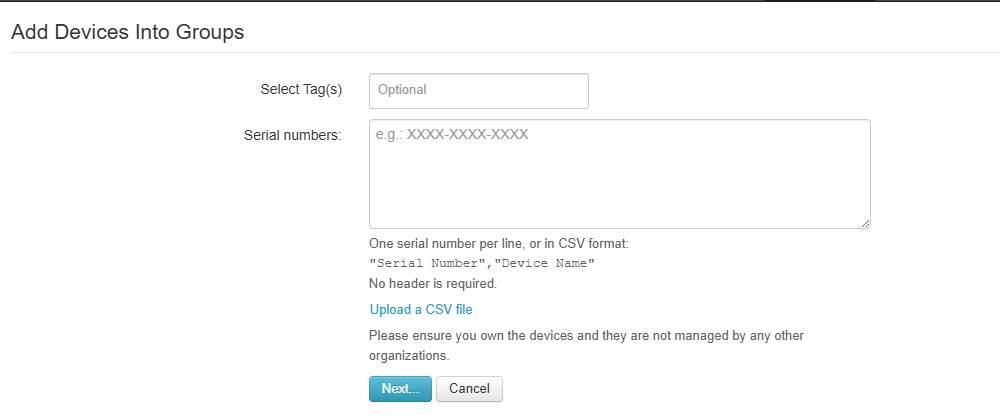
The Add Devices Into Groups form opened from Add Devices... on the Dashboard. Select Tag(s) and Serial numbers are above Next... and Cancel.
Field or control | Notes |
Optional, e.g.: XXXX-XXXX-XXXX | Entry field for a device identifier, in the format the placeholder shows |
Select Tag(s) | Tags to apply to the devices being added |
Upload a CSV file | Adds devices from a CSV file rather than one at a time |
Next... | Submits the form. At least one serial number is required |
Cancel | Closes the form |
The page is described under Add Devices (group level) in the Settings (Group Level) chapter (13.2 Add Devices (Group Level)). Enter serial numbers one per line, or as CSV lines in the form "Serial Number","Device Name".
10.1.6. The Map
The map has the same controls as the organization level Overview map, and plots the devices in this group only.
Map, at the top left of the map, selects the base layer. It shows the layer in use and opens a short list. This control is not shown in every organization. See the note on the satellite source below the table.
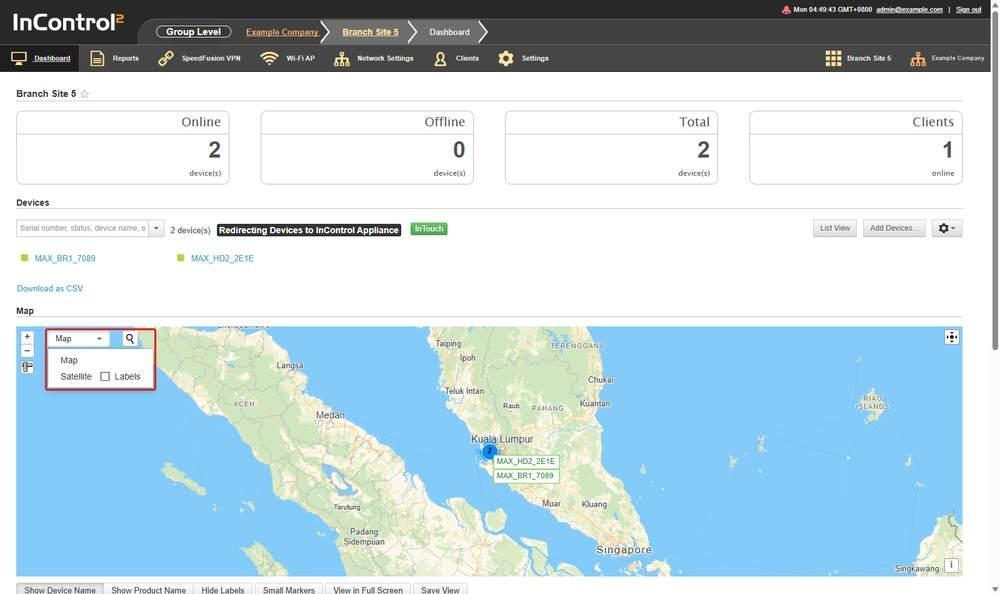
Map opens a two entry list, Map and Satellite, with the Labels checkbox on the Satellite row. The control and its list are outlined in red. List View and InTouch are above the device list, with the Redirecting Devices to InControl Appliance badge beside the device count.
Entry | Effect |
Map | The drawn map. This is the default layer |
Satellite | Satellite imagery |
Labels | A checkbox on the Satellite row. Draws labels on the map |
The satellite imagery source is set in Organization > Organization Settings under Map (9.8.8 Map). It applies to the whole organization, not per group.
Marker labels are set separately, from three options below the map.
Label option | Effect |
Show Device Name | Draws the device name against each marker |
Show Product Name | Draws the product name against each marker |
Hide Labels | Draws no label against markers |
A marker can show a past location. If its tooltip reads This marker indicates the device's location in the past, the marker shows an earlier location, not necessarily the current one.
For the route a vehicle has taken, open the device and use the location map at the bottom of Device > Device Details (14.1.13 The Location Map). It replays a track for a selected day or range, can colour the track by speed, adds events to the track with Show Events, and exports it with Download as GPX. For notifications when a device enters or leaves an area, see Geo-fencing in the Settings (Group Level) chapter (13.11 Geo-fencing).
Zoom in and Zoom out, shown as + and –, zoom the map. Attributions, shown as i, displays the map's data attributions.
The map also has a distance measuring tool. Its help text reads Click to start measuring distance.
10.1.7. The InTouch Panel
The panel lists the InTouch profiles available in the group. A Grouped By: control sets how they are arranged.

The InTouch panel with Grouped By: set to Group. Two profiles are listed under Ungrouped, each with an information icon.
InTouch above the Devices grid scrolls the page down to this panel. Profiles are defined at Device > Settings > InTouch (16.3 InTouch), and serial port-based profiles at Group > Settings > Serial-port-based InTouch (13.14 Serial-port-based InTouch).
Option | Effect |
Group | Arranges the profiles by group |
Device | Arranges the profiles by device |
Profiles that belong to neither are listed under an Ungrouped heading. Each profile is listed by name as a link.
Hover over a profile to see:
- Device, the device the profile reaches
- URL on LAN, the address on that device's LAN the profile connects to, including its scheme and port
The profile link opens a remote web address rather than a page in InControl 2.
10.1.8. The Event Log Panel
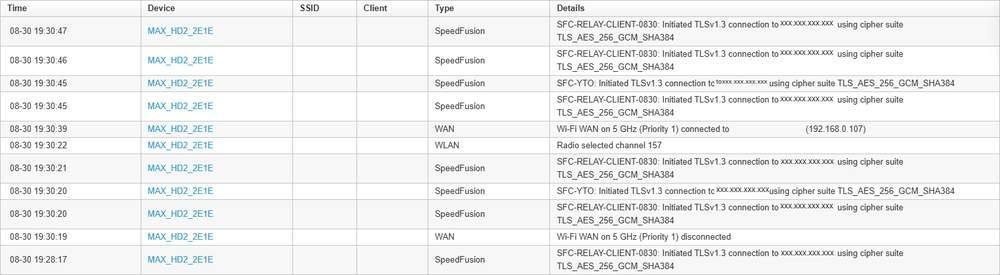
The Event Log panel. Times are shown as month, day and time. This example shows SpeedFusion, WAN and WLAN events.
Column | What it shows |
Time | When the event was reported, as month, day and time |
Device | The device that reported it. Links to the device |
SSID | The SSID involved, where the event relates to one |
Client | The client involved, where the event relates to one |
Type | The event category, for example SpeedFusion, WLAN and WAN |
Details | The event text |
The panel is a short preview. More... opens the full Event Log screen under Reports, which adds a Search & Filter panel, filtering by event type, a Location column with the coordinates reported with each event, and Log Archive Download. See 11.11 Event Log (Group Level) in the Reports chapter.
The panel shows recent events. Event Log search covers a rolling 31 days, and log archive retrieval covers a rolling 24 months. These are separate functions with different time windows.
To investigate an event on a single device, open the device name and use:
- Device > Reports > Connection Up/Down History for WAN and SpeedFusion VPN up and down times (15.12 Connection Up/Down History)
- Device > Reports > WAN Quality Reports for latency per WAN (15.6 WAN Quality Reports)
- Device > Reports > Event Log for Offline History and Online History (15.9.3 Offline History and Online History)
All three are described in the Device Reports chapter.
10.1.9. Controls on This Screen
Control | What it does |
Search devices... | Filters the Devices grid. To filter by status icon with Match all, use the search options on Group > Settings > Device Management, described under Status icons in the Group Settings chapter (13.1.2 Status Icons) |
InTouch | Scrolls the page down to the InTouch panel |
Compact View | Replaces the Devices grid with a one line list of device names |
List View | Restores the full Devices grid. Replaces Compact View while the compact list is shown |
Add Devices... | Opens the Group > Settings > Add Devices page, described above |
Edit | Shows the row selection checkboxes in the Devices grid, and Update device info by CSV file beside the export control. See Selecting devices for a bulk action below |
Tag | Tags the selected devices in bulk. Appears only once a device is selected |
Actions | Applies a bulk action to the selected devices. Appears only once a device is selected |
Hide expiration notices | Hides expiration notices in the Devices grid. Whether administrators below organization level see expiration notices is set by Show Subscription Expiration Dates and Notices to non-Organization Administrators under Advanced Settings in Organization Settings (9.8.4 Advanced Settings) |
Download as CSV | Exports the Devices grid |
Update device info by CSV file | Updates device information from an uploaded CSV file |
Map | Selects the map's base layer. Offers Map and Satellite, with a Labels checkbox. Not shown in every organization |
Zoom in | Zooms the map in. Shown as + |
Zoom out | Zooms the map out. Shown as – |
Attributions | Shows the map's data attributions. Shown as i |
Small Markers | Draws the map markers at a smaller size |
View in Full Screen | Shows the map full screen |
Save View | Saves the current map view |
Group / Device | Sets how the InTouch panel groups its profiles |
Refresh | Reloads the Event Log panel |
More... | Opens the full Event Log screen under Reports |
10.1.10. Selecting Devices for a Bulk Action
The selection checkboxes, Tag and Actions appear once Edit is clicked. Follow these steps:
Step | What appears |
1. Click Edit, below the grid | A checkbox column appears on the left of the Devices grid. Tag and Actions appear above the grid, greyed out |
2. Tick one or more devices | Selected N devices: appears above the grid, naming them, with Clear all selections beside it |
3. | Tag and Actions become active |
Caution: Every Actions entry applies to all devices named on the Selected N devices: line, not to the row last clicked. Check that line before applying Restore to factory defaults..., Remove..., Move to... or any Top Up entry.

The grid after Edit with one device ticked. Selected 1 devices names it, Tag and Actions are above the grid, and the checkbox column is on the left.
Tag and Actions are the same bulk controls as on Group > Settings > Device Management, documented in the Settings (Group Level) chapter (13.1.6 The Actions Menu). Their entries vary:
- Entries depend on the devices in the group. A group containing switches and access points offers AP routing mode..., DHCP snooping and STP bridge priority. A group of routers only does not show them.
- Entries that do not apply to the selected device are greyed out, not hidden.
- An entry missing from the menu means no device in the group supports it. A greyed out entry means the selected device does not support it.
On Group > Settings > Device Management and Organization Settings > Device Management, the checkboxes are shown when the grid loads, and Tag and Actions become active once a row is ticked.
Edit also shows Update device info by CSV file beside Download as CSV. Hide expiration notices is shown below the grid without Edit.