
15. Device Reports
The Reports menu of a single device contains thirteen read-only screens covering traffic, availability, wireless, deep packet inspection and logging for that device. Each screen uses the data the device has reported to InControl 2, so a device with little activity shows No data available on some screens. Reporting at group and organization level is covered in separate chapters (see 11 Reports and 4 Organization Reports). Several reports offer longer date ranges at group level than at device level. The retention window differs by report family and by level, so check the date range of each screen.
Which report answers which question
Question | Go to | See |
Did the device restart or lose power? | Device Availability on Device Reports, and Uptime on Device Details | 15.2.3 Internet Availability and Device Availability, 14.1.4 Information |
Which WAN dropped, when, and for how long? | Connection Up/Down History, WAN tab | |
What happened around that drop? | Select the timestamp in Connection Up/Down History: the Event Log opens on a ten minute window | |
Was the link degraded before it dropped? | WAN Quality Reports, latency with WAN Up and WAN Down marks | |
Was the cellular signal weak? | WAN Quality Reports with the cellular WAN selected: RSRP, SINR and RSRQ over time | |
Did SpeedFusion keep the site up? | SpeedFusion Score, WAN table, and Connection Up/Down History, SpeedFusion VPN tab | |
Who or what used the data? | Top Clients by Usage, DPI Reports, and Bandwidth and Usage Reports on Monthly | 15.2.4 Top Clients by Usage, 15.4 DPI Reports, 15.7 Bandwidth and Usage Reports |
What was the monthly availability? | Connection Up/Down History, monthly table | |
Why is traffic blocked? | Firewall Log, Content Blocking Log |
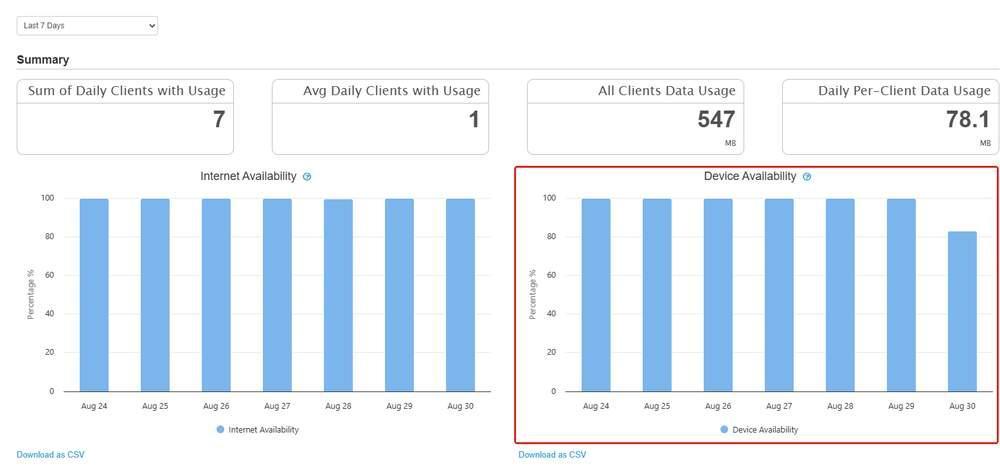
Device Availability, outlined in red, on Device Reports. A day below 100 percent is a day on which the device was not running for the full day.
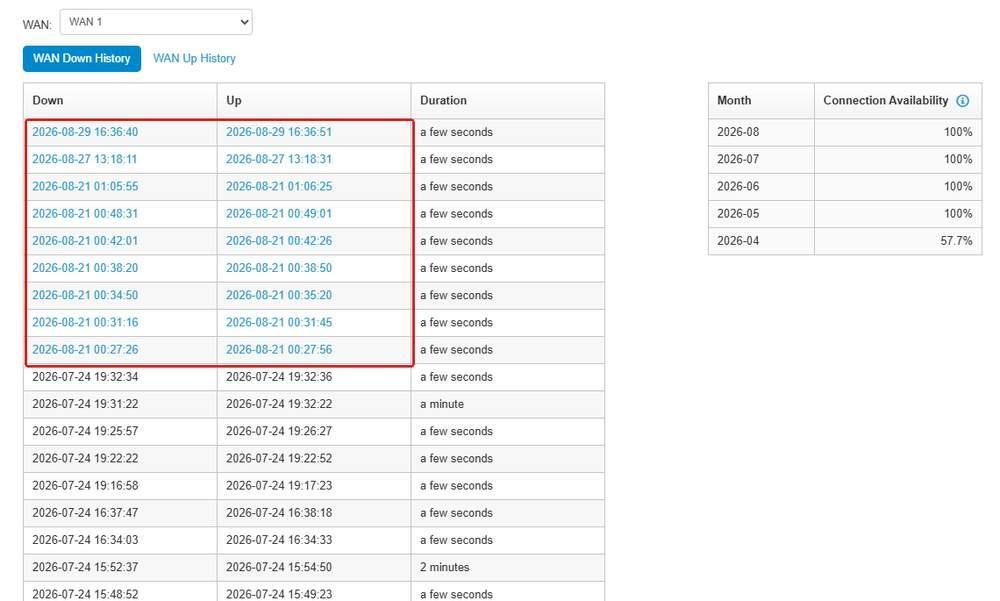
The linked Down and Up timestamps, outlined in red, on the WAN tab. Selecting one opens the Event Log on a ten minute window around it.
15.1. SpeedFusion Score
Rates one SpeedFusion profile at a point in time and lists InControl 2's suggestions for improving it. Use it to assess the health of a tunnel.
To find the weakest tunnels in a group, check the SpeedFusion Score column on the group Dashboard (10.1.3 The Devices Grid), then open this screen on the devices with the lowest scores.
Where to find it
Device > Reports > SpeedFusion Score
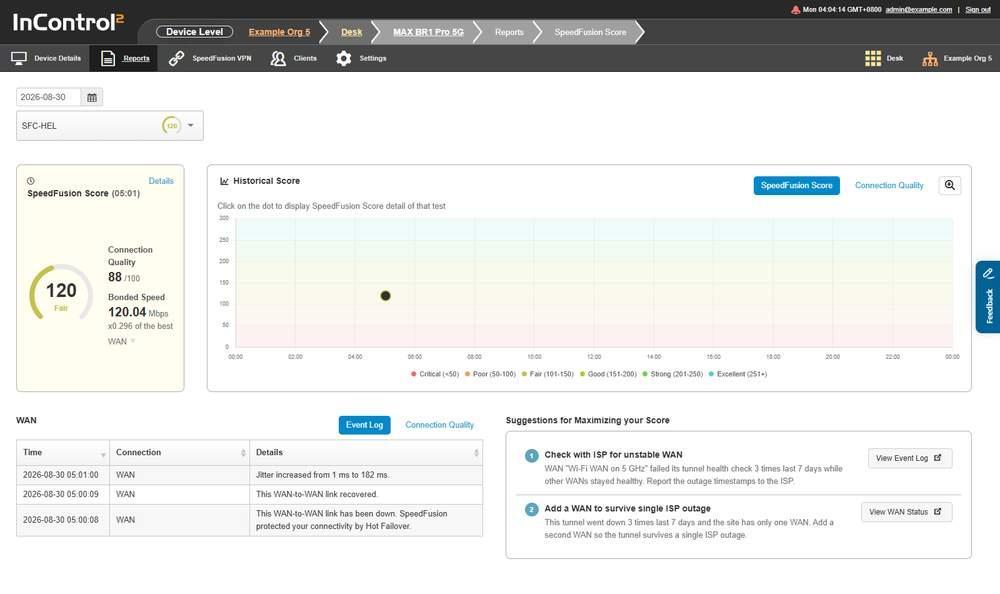
SpeedFusion Score with a date and profile selected. The score and its rating are at the top, with Historical Score, WAN and Suggestions below.
15.1.1. Date and Profile
When opened without a selection, the screen selects today's date and one of the device's SpeedFusion profiles, and shows that profile's latest score. A device with no score history shows No data available. Two controls set what is reported:
Control | What it selects |
Date field | The day to report on |
Profile selector | The SpeedFusion profile to score. Lists the profiles configured on the device. The score is per profile, not per device: a device with several SpeedFusion profiles has a separate score for each, and the scores can differ widely |
Changing either control redraws the report for that day and profile. Both a date and a profile are required. If the screen shows No data available, check both selectors.
15.1.2. The Score
The section heading shows the time of the test, for example SpeedFusion Score(05:01).
Field | What it shows |
SpeedFusion Score | The score as a number, with a rating word below it, such as Fair |
Connection Quality | A score out of 100 for the test |
Bonded Speed | Throughput in Mbps, with the same figure expressed as a multiple of the best single WAN, for example x0.296 of the best WAN |
Details opens the Score Detail dialog, a reference table of the rating scale, one row per rating from Excellent down to Critical:
Column | What it shows |
Scale | The rating word |
SpeedFusion Score | The score range for that rating, for example 151 to 200 for Good |
Description | A short description of the rating |
Close closes the dialog.
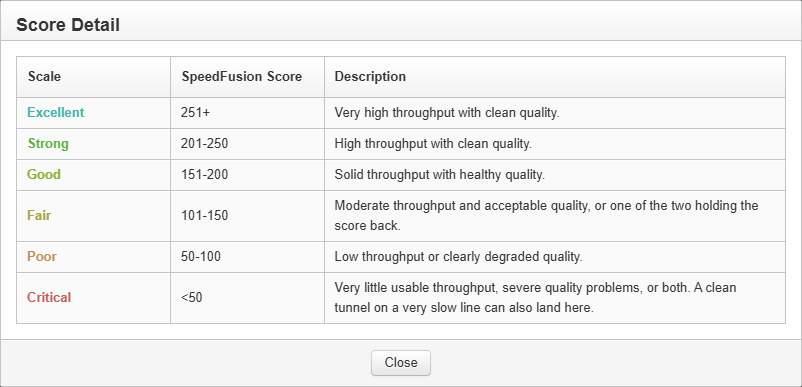
The Score Detail dialog opened from Details. It lists each rating with its score range and a description. Close closes it.
The Bonded Speed multiple compares the bonded speed (download plus upload) with the speed of the best single WAN from its most recent per WAN test. A multiple below x1 means the tunnel delivered less than that WAN alone.
15.1.3. Historical Score
Plots scores over time, to show whether a profile is degrading. It has two views:
View | What it plots |
SpeedFusion Score | The score across the period |
Connection Quality | The connection quality figure across the period |
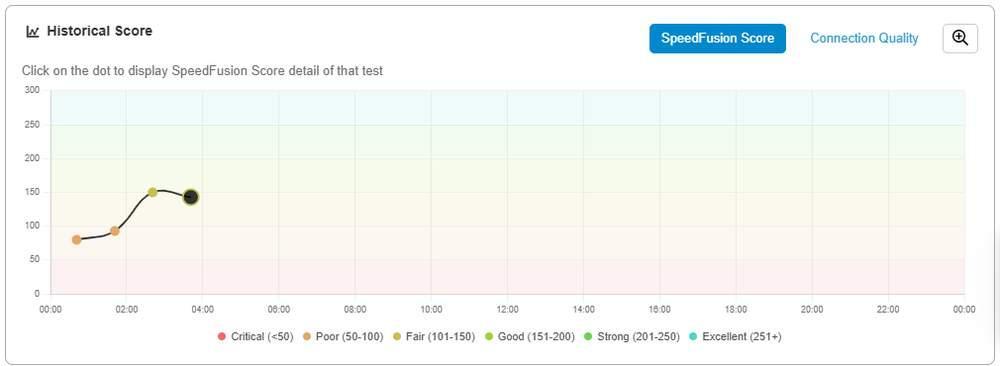
Historical Score for one day. Each dot is a test, and the background bands match the rating legend below. SpeedFusion Score and Connection Quality switch the view.
The chart states Click on the dot to display SpeedFusion Score detail of that test. Each point is a test that can be opened.
Open Historical Report is a separate control in this section.
The chart legend shows the score range for each rating:
Rating | Score |
Critical | Below 50 |
Poor | 50 to 100 |
Fair | 101 to 150 |
Good | 151 to 200 |
Strong | 201 to 250 |
Excellent | 251 and above |
The scale is open ended at the top. There is no maximum score.
15.1.4. WAN
A table of the events behind the score, with two views, Event Log and Connection Quality.
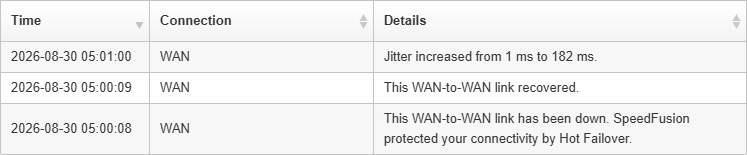
The WAN table. Each row shows the time, the connection and the event, here a jitter increase, a link going down and the same link recovering.
Column | What it shows |
Time | Timestamp of the event |
Connection | The WAN the event relates to |
Details | The event, for example a jitter increase, a link going down, or a link recovering |
The table states when SpeedFusion maintained connectivity, for example This WAN-to-WAN link has been down. SpeedFusion protected your connectivity by Hot Failover.
15.1.5. Suggestions for Maximizing Your Score
InControl 2 lists specific recommendations based on the device's recorded data. Each has a heading, an explanation citing that data, and a control that opens the relevant screen.
Control | Where it goes |
View Event Log | The device's Event Log |
View WAN Status | The device's overview screen |
Each suggestion states the cause and the next step. For example, Check with ISP for unstable WAN explains that one WAN failed its tunnel health check 3 times in the last 7 days while the other WANs remained healthy, and advises reporting the outage timestamps to the ISP.
15.1.6. Controls on This Screen
Control | What it does |
Date field | Sets the day to report on |
Profile selector | Selects the SpeedFusion profile to score |
Details | Opens the Score Detail dialog, a table of the rating scale |
SpeedFusion Score | Switches Historical Score to the score view |
Connection Quality | Switches Historical Score to the connection quality view |
Open Historical Report | Opens the historical report |
Event Log | Switches the WAN panel to its event view |
Connection Quality | Switches the WAN panel to its connection quality view |
View Event Log | Opens the device's Event Log |
View WAN Status | Opens the device's overview screen |
15.2. Device Reports (Device Level)
Shows clients, data usage and uptime for one device over a selected date range.
Where to find it
Device > Reports > Device Reports
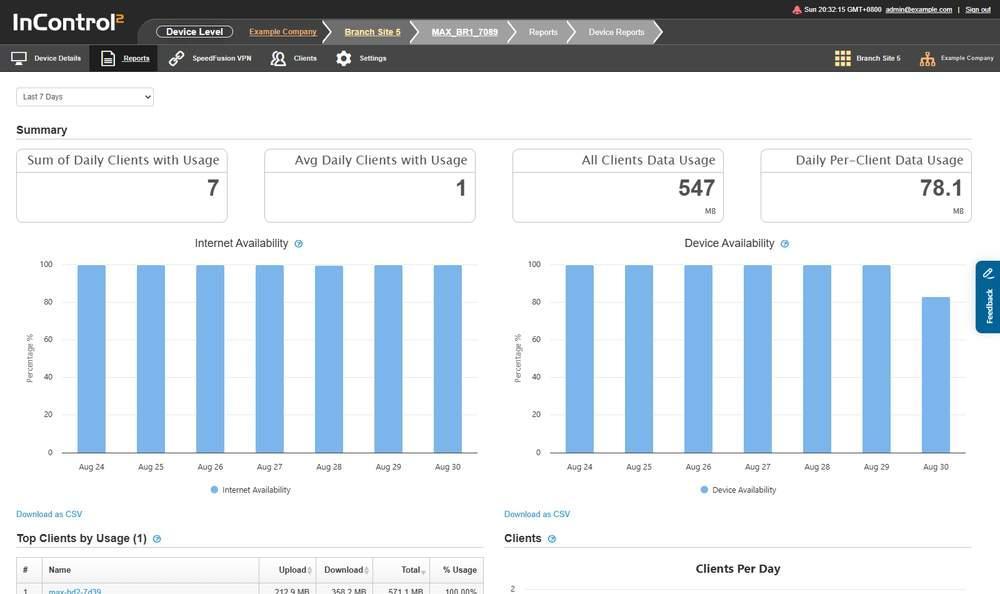
The top of Device Reports. The date range selector is above the Summary tiles, and a Download as CSV link is below each chart.
15.2.1. Choosing the Date Range
A single date range selector above the report applies to every section on the page. At device level, the available ranges depend on the device. Every device offers these five:
- Today
- Yesterday
- Last 7 Days
- Last 31 Days
- Custom
Many devices also offer longer ranges, up to the same eight as group level: Last 91 Days, Last 182 Days and Last 12 Months.
Custom sets a start and end date instead of a preset range. Selecting it adds two date fields and an Update button below the selector: the left field is the start date and the right field the end date. Both are pre-filled with the current period, in the format YYYY-MM-DD. Click Update to redraw the report.
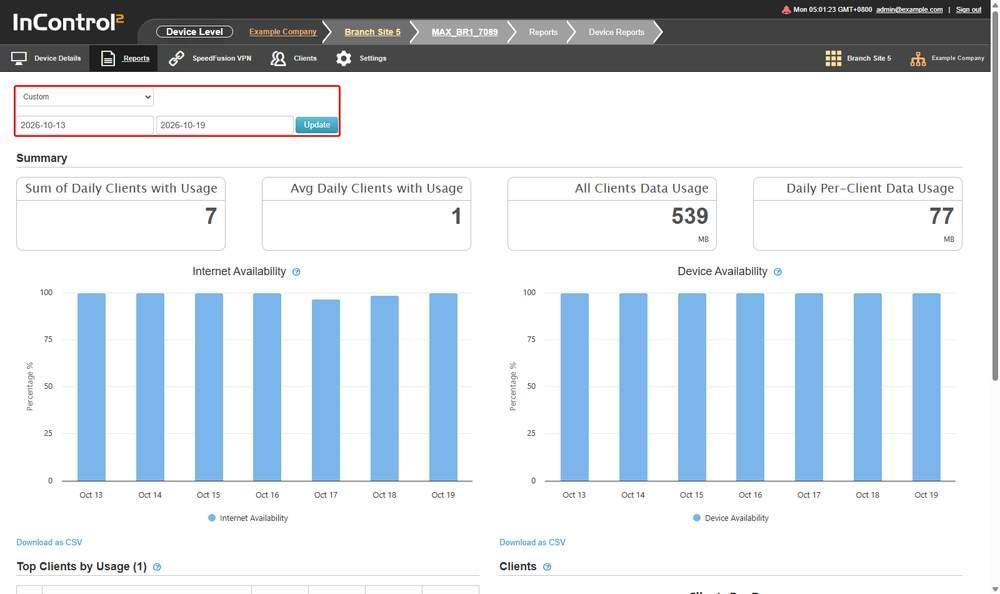
Device Reports with Custom selected. The selector, the two date fields and Update, outlined in red, are above the Summary tiles.
If the required range is not offered on the device, a summary report can be found at Group > Reports > Device Reports (11.2 Device Reports (Group Level)), which always offers Last 91 Days, Last 182 Days and Last 12 Months.
15.2.2. Summary
Four tiles are shown at the top of the page.

The four Summary tiles. The two data usage tiles show their unit, MB here, below the figure.
Tile | What it reports |
Sum of Daily Clients with Usage | Daily counts of clients that passed traffic, added across the range |
Avg Daily Clients with Usage | The daily average of that count |
All Clients Data Usage | Total data passed by all clients in the range |
Daily Per-Client Data Usage | Data per client per day |
15.2.3. Internet Availability and Device Availability
Two separate charts, each plotted as Percentage % against a daily axis for the selected range. Their information icons give the formula used.
Chart | How it is calculated |
Internet Availability | Total amount of InControl 2 online time of the device in the day, divided by total uptime of the device in the day |
Device Availability | Total uptime of the device in the day, divided by total amount of time of the day |
The two charts measure different things:
- Device Availability is the share of the day the device was powered on and running.
- Internet Availability is the share of that running time during which the device could reach InControl 2.
A device that runs all day but loses its WAN shows 100 percent device availability and less than 100 percent internet availability.
Internet Availability is measured as time connected to InControl 2. It reflects the device's reachability, not each client's internet experience. For per link figures, use Connection Up/Down History.
Download as CSV below the charts exports both availability series in one file.
15.2.4. Top Clients by Usage
The heading shows the row count in brackets, for example Top Clients by Usage (1).

A Top Clients by Usage row. The client Name is a link, and % Usage shows that client's share of all client usage.
Column | What it shows |
# | Rank within the range |
Name | Client name |
Upload | Data sent by the client |
Download | Data received by the client |
Total | Upload plus download |
% Usage | That client's share of all client usage |
The section's information icon states that each client's usage figures are the sum of that client's usage on the device across the selected period.
Use this table with DPI Reports, which shows application categories, to identify the clients or traffic types that used the data on a metered link.
15.2.5. Top Client Device Manufacturers

The manufacturer table. The information icons on # Clients and Usage state that clients not identified by MAC address are excluded.
Column | What it shows |
# | Rank within the range |
Manufacturer | Manufacturer resolved from the client MAC address |
# Clients | Number of clients from that manufacturer |
% Clients | That manufacturer's share of the client count |
Usage | Data passed by those clients |
% Usage | That manufacturer's share of total usage |
The table has two information icons:
- The client count is a breakdown of all connected clients by manufacturer within the selected period. Clients not identified by MAC address are excluded.
- The usage figures show data consumed by each manufacturer's clients within the selected period, with the same MAC address exclusion.
15.2.6. Clients
A daily chart headed Clients Per Day, with two series:
Series | What it counts |
Clients with usage | Unique clients that accessed the device and consumed data on that date |
Connected Wi-Fi clients | Connected Wi-Fi clients only. Ethernet clients are excluded |
The chart shows the instruction Click on a column to view the day's hourly usage. Clicking the bar for a date replaces the daily chart with Clients Per Hour for that day, and adds a table below it headed with the date. The table lists the clients counted on that day, with #, Name and IP Address columns, its own Download as CSV link and a Back button.
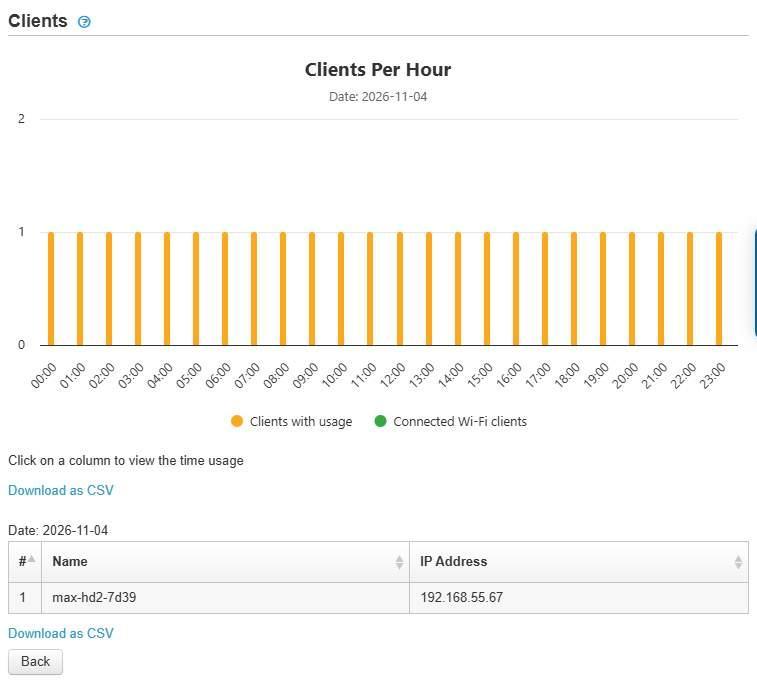
The Clients section after a day's column is clicked. Clients Per Hour is above, and the table headed Date lists that day's clients.
The hourly chart carries the instruction Click on a column to view the time usage. Clicking an hour column narrows the table to the clients counted in that hour, and the heading above the table changes from the date to the time.
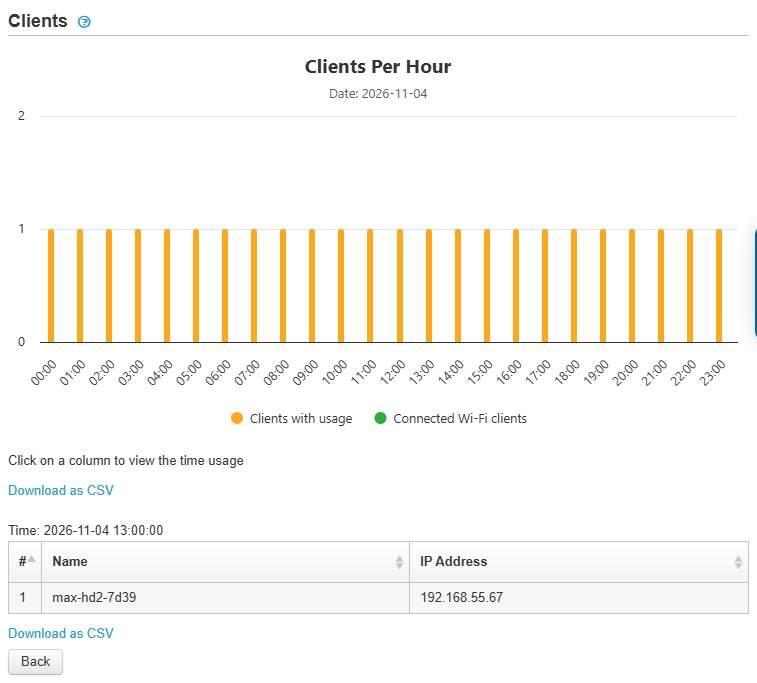
After an hour column is clicked. The table heading reads Time with the hour, and only the clients of that hour are listed.
Back returns to the daily chart.
How clients are counted
The hourly chart and the daily bar use different counting rules.
View | Rule |
Hourly chart | A client connected across several hours is counted once in each of those hours |
Daily bar | The same client is counted only once for the day |
The sum of the hourly figures therefore exceeds the daily count. Use the daily bar for a day's client count, and the hourly chart to see when clients were present.
Clients are identified primarily by MAC address, and then by IP address. Top Client Device Manufacturers excludes clients not identified by MAC address, while the Clients chart falls back to IP address.
15.2.7. Controls on This Screen
Control | What it does |
Date range selector | Sets the reporting period for every section on the page |
Download as CSV | Exports the section above it, for the selected start and end dates. Available on Internet Availability, Device Availability, Top Clients by Usage, Top Client Device Manufacturers and Clients. Not available on the Summary tiles |
Back | Below the Clients section after a day or hour column is clicked. Returns to the daily chart |
15.3. Wi-Fi Reports (Device Level)
Shows wireless clients and SSID usage on one device.
Where to find it
Device > Reports > Wi-Fi Reports
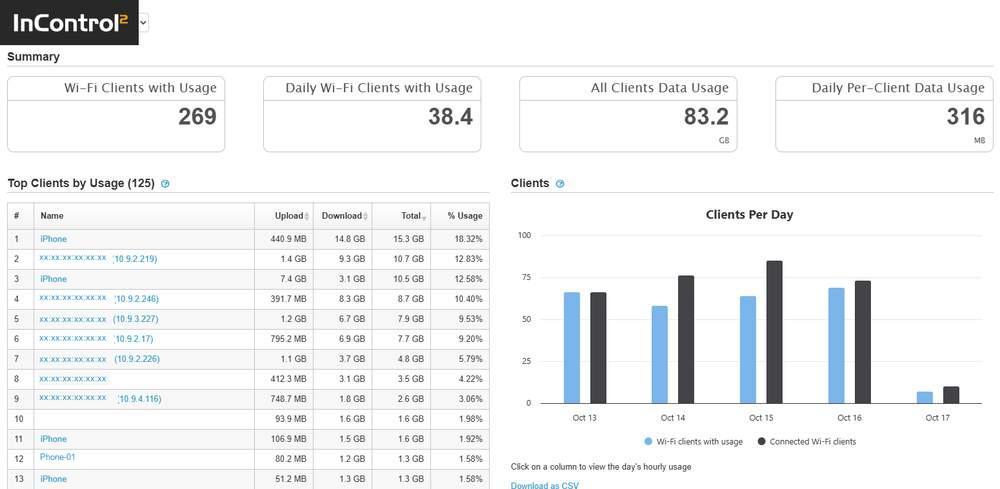
Wi-Fi Reports for the last 7 days on an access point with clients. The four Summary tiles are above Top Clients by Usage on the left and the Clients Per Day chart on the right.
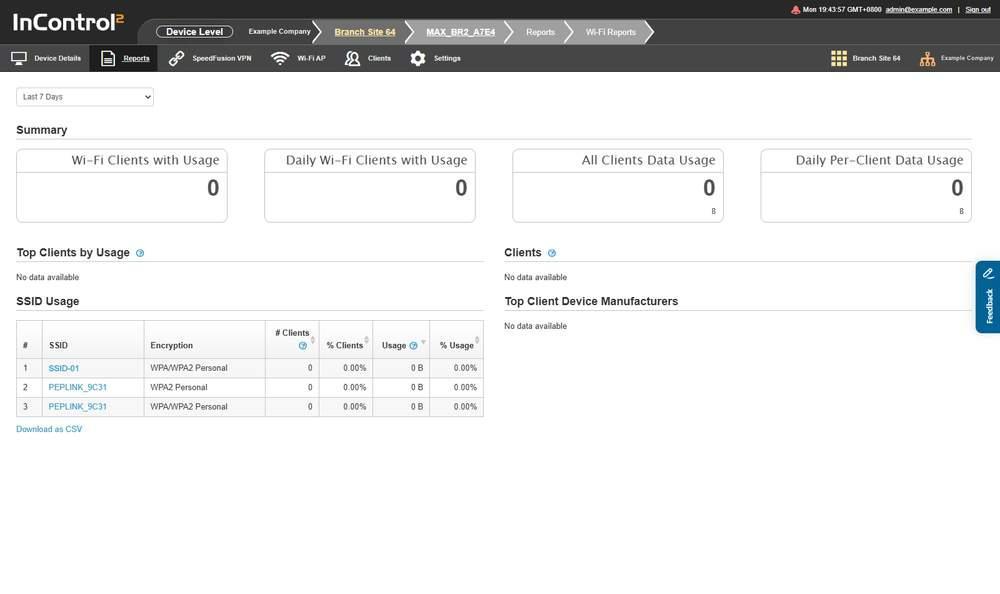
Wi-Fi Reports on a device with no wireless clients. SSID Usage lists every configured SSID with zero counts, and the other sections show No data available.
15.3.1. Choosing the Date Range
The available ranges depend on the device. Every device offers Today, Yesterday, Last 7 Days, Last 31 Days and Custom. Many also offer Last 91 Days and Last 182 Days, and some also offer Last 12 Months. Custom works as on Device Reports (15.2.1 Choosing the Date Range).
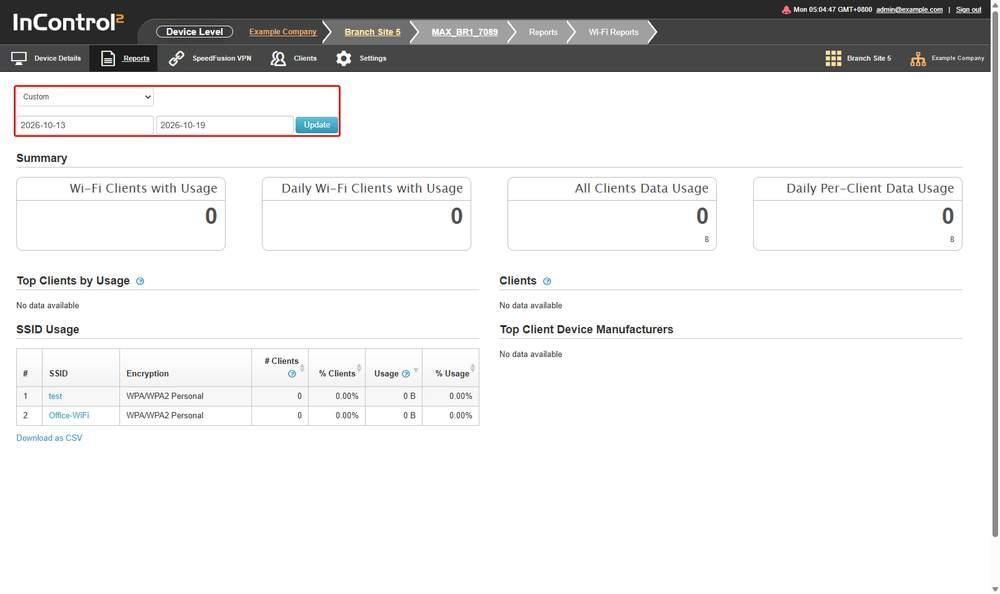
Wi-Fi Reports with Custom selected. The selector, the two date fields and the Update button, outlined in red, are above the Summary tiles.
If the required range is not available on the device, a summary report can be found at Group > Reports > Wi-Fi Reports (11.3 Wi-Fi Reports (Group Level)), which always offers up to Last 12 Months.
15.3.2. Summary

The four Wi-Fi Summary tiles, all showing zero on a device with no wireless client traffic.
Tile | What it reports |
Wi-Fi Clients with Usage | Wi-Fi clients that passed traffic in the range |
Daily Wi-Fi Clients with Usage | The daily figure for the same count |
All Clients Data Usage | Total data passed by Wi-Fi clients in the range |
Daily Per-Client Data Usage | Data per Wi-Fi client per day |
15.3.3. Top Clients by Usage
Ranks the clients that used data on this device in the selected period. The information icon states that each client's usage figures are the sum of that client's usage on the device across the selected period, as on Device Reports.
Column | What it shows |
# | Rank within the period |
Name | The client's name, which links to the client |
Upload | Data the client sent |
Download | Data the client received |
Total | Upload and download combined |
% Usage | The client's share of the usage total |
Download as CSV is below the table.
15.3.4. SSID Usage
Lists every configured SSID, even when no client has associated. A row of zeros means the SSID exists and carried no traffic.
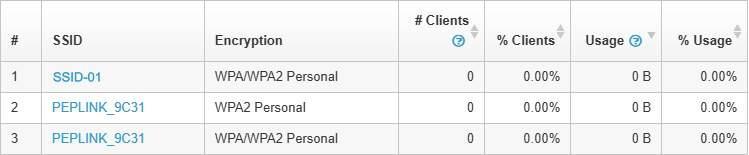
SSID Usage listing three configured SSIDs, each with zero clients and zero usage. The information icons are below # Clients and beside Usage.
Column | What it shows |
# | Row number |
SSID | The SSID name. The same name can appear on more than one row, with a different Encryption value on each, so identify rows by name and encryption together |
Encryption | The SSID's encryption mode, for example WPA/WPA2 Personal |
# Clients | Wi-Fi clients connected to that SSID on this device within the selected period |
% Clients | That SSID's share of the client count |
Usage | Data consumed by Wi-Fi clients on that SSID on this device in the selected period |
% Usage | That SSID's share of total usage |
The information icons on the client count and usage figures state that both are limited to this device and the selected period.
15.3.5. Clients
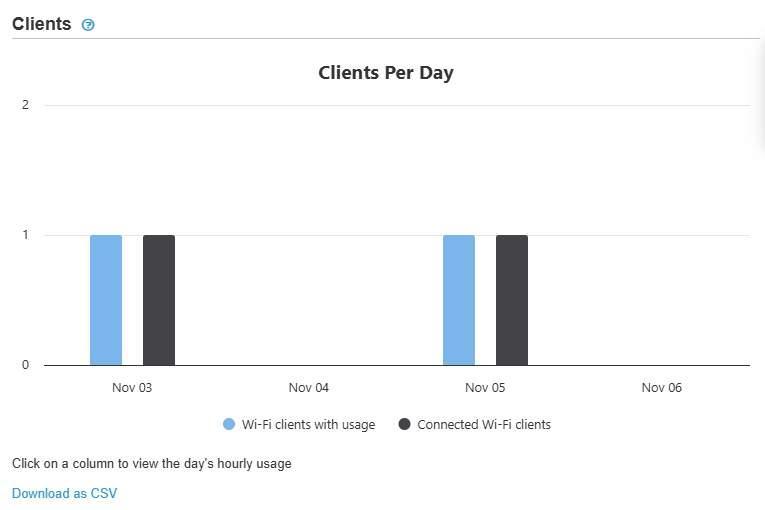
The Clients chart on Wi-Fi Reports, headed Clients Per Day, with one pair of columns per day and Download as CSV below it.
The chart has two series, matching the pair on Device Reports:
Series | What it counts |
Wi-Fi clients with usage | Unique Wi-Fi clients that accessed the device and consumed data on that date |
Connected Wi-Fi clients | Connected Wi-Fi clients only. Ethernet clients are excluded |
Clicking the bar for a date opens a chart of the connected client count for each hour of that day, with a table below it listing that day's clients by Name and IP Address. Clicking an hour column narrows the table to that hour, and Back returns to the daily chart, exactly as on Device Reports.
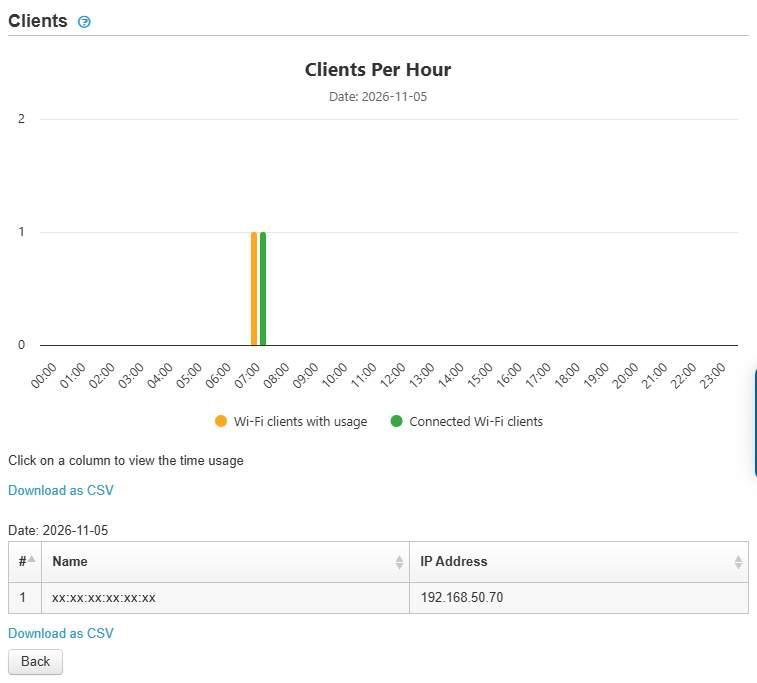
After a day's column is clicked: Clients Per Hour above, and the table of that day's clients below, with its own Download as CSV link and Back.
The counting rules are also the same as on Device Reports (15.2.6 How clients are counted):
View | Rule |
Hourly chart | A client connected across several hours is counted once in each of those hours |
Daily bar | The same client is counted only once for the day |
15.3.6. Top Client Device Manufacturers
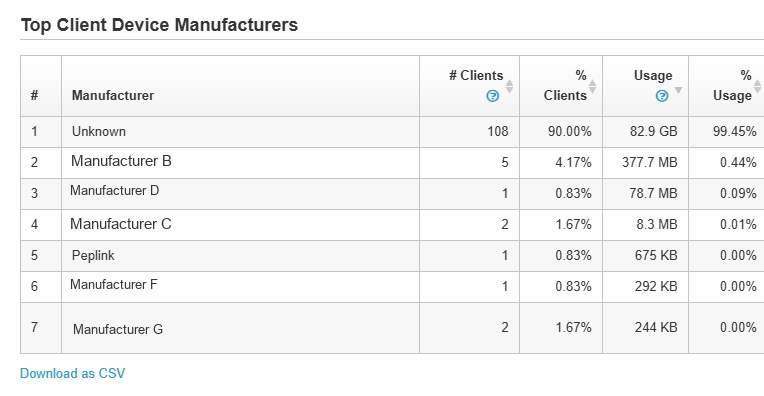
The manufacturer breakdown for an access point with Wi-Fi clients. Unidentified clients are grouped on the Unknown row. The information icons are on # Clients and Usage.
The table breaks down the device's connected clients by manufacturer for the selected range, sorted by Usage. Information icons on # Clients and Usage state that clients not identified by MAC address are excluded. Clients whose manufacturer cannot be resolved are grouped as Unknown. Download as CSV is below the table. The columns are:
Column | What it shows |
# | Rank within the range |
Manufacturer | Manufacturer resolved from the client MAC address |
# Clients | Number of clients from that manufacturer |
% Clients | That manufacturer's share of the client count |
Usage | Data passed by those clients |
% Usage | That manufacturer's share of total usage |
15.3.7. Controls on This Screen
Control | What it does |
Date range selector | Sets the reporting period for the whole page |
Download as CSV | Exports the section above it, for the selected start and end dates. A link appears below each section that has data |
Back | Below the Clients section after a day or hour column is clicked. Returns to the daily chart |
15.4. DPI Reports
Shows which application categories used the data on this device, identified by deep packet inspection, for example on a metered link.
Where to find it
Device > Reports > DPI Reports
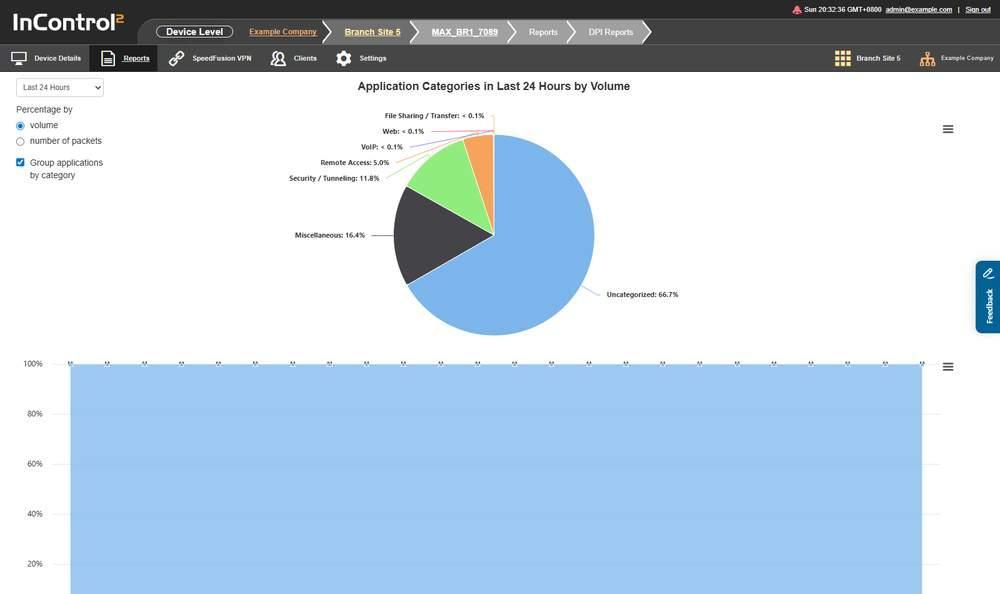
DPI Reports. The pie chart shows the category split for the selected period, and the stacked chart below plots the same split by hour.
15.4.1. What This Screen Shows
- A single section whose heading reflects the current selections, for example Application Categories in Last 24 Hours by Volume.
- A pie chart showing each category's share, labelled with the percentage. Very small shares are shown as < 0.1%. The pie labels only categories with a measurable share, so a category can appear in the chart legend but not on the pie.
- A stacked chart below, plotting the same categories across the period, with an hourly axis on the Last 24 Hours setting and a 0 to 100 percent scale.
- The page states that any application's hourly data size smaller than 1 MB is rounded down to 0. Low volume applications can therefore show as zero.
Example categories:
- Uncategorized
- Miscellaneous
- Security / Tunneling
- Remote Access
- VoIP
- Web
- File Sharing / Transfer
- Gaming
- Audio Video Streaming
Uncategorized is a separate category and can be the largest share on a device whose traffic is mostly tunnelled.
15.4.2. Controls on This Screen
Control | What it does |
Range selector | Sets the reporting period. Options are Last 24 Hours, Last 7 Days, Last 31 Days |
Percentage by: volume | Weights the breakdown by data volume |
Percentage by: number of packets | Weights the breakdown by packet count |
Group applications by category | Groups individual applications into their category. When cleared, the chart lists applications instead of categories. This section describes the category view, with the box ticked |
This screen has no Download as CSV control.
15.5. Site Survey
Lists the wireless scans recorded by the device, one row per scan, for example to check coverage at a site.
The menu entry is listed on 5G cellular devices, for example MAX BR2 Pro, MAX BR1 Pro 5G and 5G Adapter. The device menu varies by product type and device state, so the entry is not listed on every device.
Where to find it
Device > Reports > Site Survey
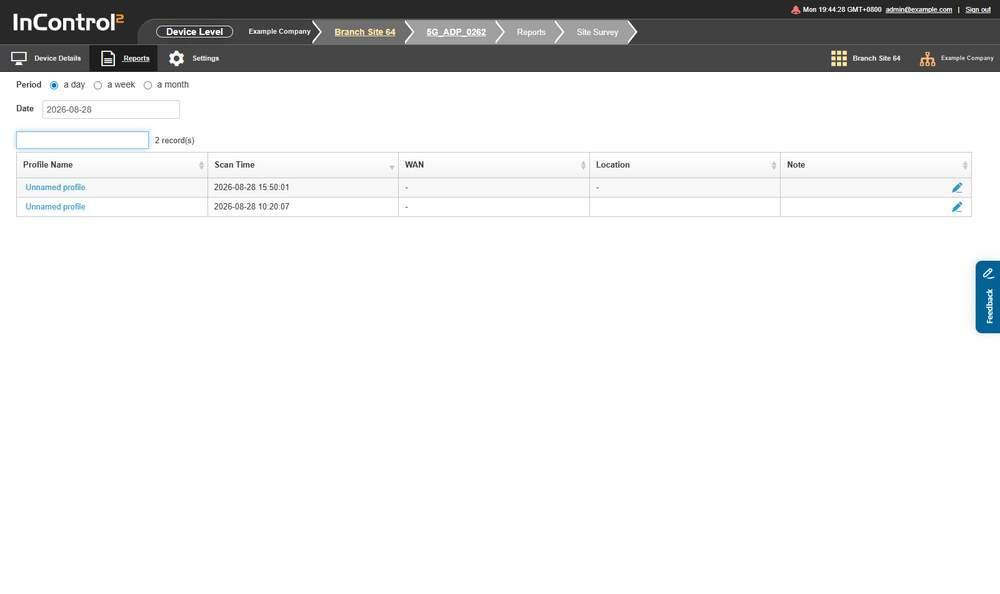
Site Survey with a period and date selected. The record count is above the table, and the scans are listed newest first.
15.5.1. Choose a Period and a Date
When opened without a selection, the screen selects the latest day on which the device recorded scans and lists those records. Use Period and Date to list a different span.

The Period radio buttons, set to a day, with the Date field below them.
Control | Options |
Period | a day, a week, a month |
Date | The day, week or month to list, depending on the selected Period |
Above the table, InControl 2 shows the number of matching scans, in the form 11 record(s). The count covers the whole result, not only the current page. A count higher than the visible rows means there are further pages.
15.5.2. The Scan Table

The scan table, with the search box and the record count above it. The pencil icon at the end of each row is in the Note column. Location values are hidden in this image.
Column | What it shows |
Profile Name | The name of the scan profile that produced the record. Scans are recorded per profile, so the name repeats across rows when a profile scans on a schedule |
Scan Time | When the scan ran |
WAN | The connection used for the scan |
Location | The device's location at the time |
Note | Free text recorded for the scan. A dash means no note |
The table is paged, with Previous and Next controls. This screen has no Download as CSV control.
15.5.3. Controls on This Screen
Control | What it does |
Period: a day / a week / a month | Sets the span the Date field covers |
Date | Sets the day, week or month to list |
Search | Filters the listed scans |
Previous, Next | Page through the scan list |
15.6. WAN Quality Reports
Charts the quality of one WAN connection at a time, showing whether a WAN degraded before it dropped. Throughput has a separate export.
Where to find it
Device > Reports > WAN Quality Reports
15.6.1. Selecting a WAN
One of the device's WANs is already selected when the screen opens, and the chart shows that WAN for the date in the date picker. The WAN: selector lists every connection on the device, and the heading shows the selection, for example WAN Quality - Cellular.
Example options:
- Please Select...
- Cellular/1
- Cellular/2
- Cellular/3
- VLAN WAN 1
- WAN
- Wi-Fi WAN on 2.4 GHz
- Wi-Fi WAN on 5 GHz
- Cellular
The list is built from the device's connections, so it differs by device. A device with multiple cellular modems lists each modem separately, for example Cellular/1, Cellular/2 and Cellular/3. The heading shows the option selected.
The series shown depend on the WAN. For a wired WAN with data, the chart plots latency against a Latency (ms) axis and a time axis, with WAN Up and WAN Down annotations. For a cellular WAN, the chart offers signal series instead. Tick Throughput to add per-minute throughput to the chart. A WAN with no data for the day shows No data available. In that case, check the date picker at the top and the selected WAN.
15.6.2. Zoom
A row of zoom levels sets the span of the chart:
- 10 Mins
- 30 Mins
- 3 Hours
- 6 Hours
- 12 Hours
- All
All can take longer to refresh than the other zoom levels.
Two time fields in the same row, separated by an arrow, show the span the chart covers.
15.6.3. Choosing the Date
The date picker at the top of the screen sets the day shown on the chart. Tick Date range beside it to chart a range of days.
The selector in the Download as CSV: row at the bottom of the screen offers the date chosen in the date picker first, then whole months. It applies to the CSV export only. It does not change the chart.
15.6.4. Cellular Signal
Use this procedure to determine whether a cellular connection went down because of poor signal. The signal history of a cellular WAN is available on this screen, not on Device Details.
- 1.Open Device > Reports > WAN Quality Reports.
- 2.In WAN:, select the cellular WAN.
- 3.Set the day with the date picker at the top.
- 4.Tick the series to plot. The available series depend on the WAN and on the data it has reported. A cellular WAN offers:
- 5.Hover over a point on the chart to display the raw values for that moment.
- Signal Bars, read against the right axis, 0 to 5
- Signal Strength and Signal Quality, plotted as levels on the left axis, from Very poor through Poor, Fair, Good and Very good to Excellent
- Throughput
- Latency and packet loss, only where the WAN has such data
The hover box shows the radio technology and a table with these columns:
Column | Shows |
Band | The band in use, with its frequency |
Channel | The channel number |
Strength (RSRP) | Reference signal received power in dBm, with a level word such as Good |
Quality (SINR) | Signal to interference plus noise ratio in dB, with a level word |
Quality (RSRQ) | Reference signal received quality in dB, with a level word |
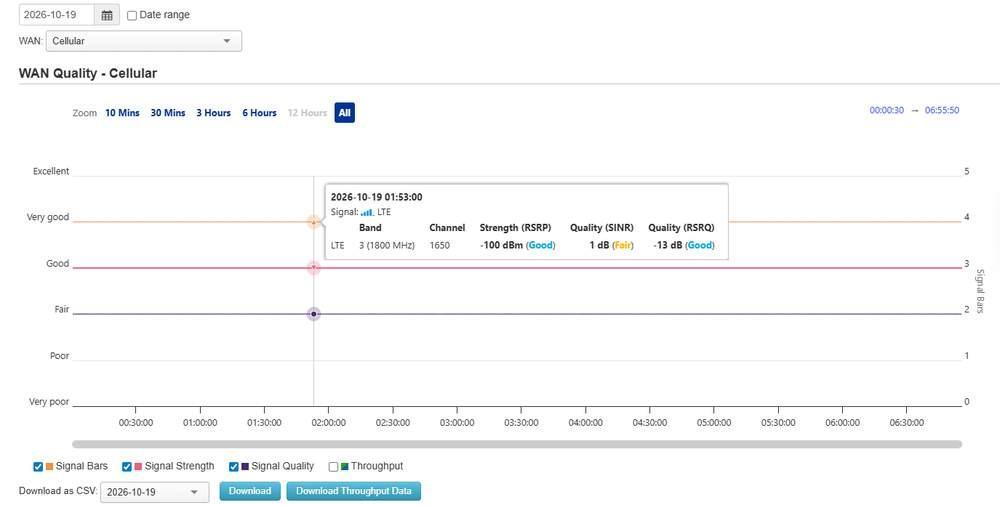
WAN Quality with a cellular WAN selected in WAN: and the day set with the date picker at the top. The hover box shows the band, channel, RSRP, SINR and RSRQ, with a level word for each.
Hover box details:
- The first column shows the radio technology of the row, for example LTE.
- The bars icon after Signal: shows the Signal Bars value at that moment. It appears on samples that include a Signal Bars value.
- Each level word is colour coded, from Excellent in green down to Very poor. All six words used on the left axis also appear in the hover box.
- Band and channel follow the radio and can change during the day.
- With Throughput ticked, the hover box adds Download and Upload in kbps at each per minute point, and a Throughput axis in kbps appears on the far left.
- The time in the hover box depends on the zoom level. At All it is rounded to the minute. At 30 Mins or 10 Mins it is the exact sample time.
- Periods without signal samples are blank on the chart. Hovering over a blank period shows the nearest sample.
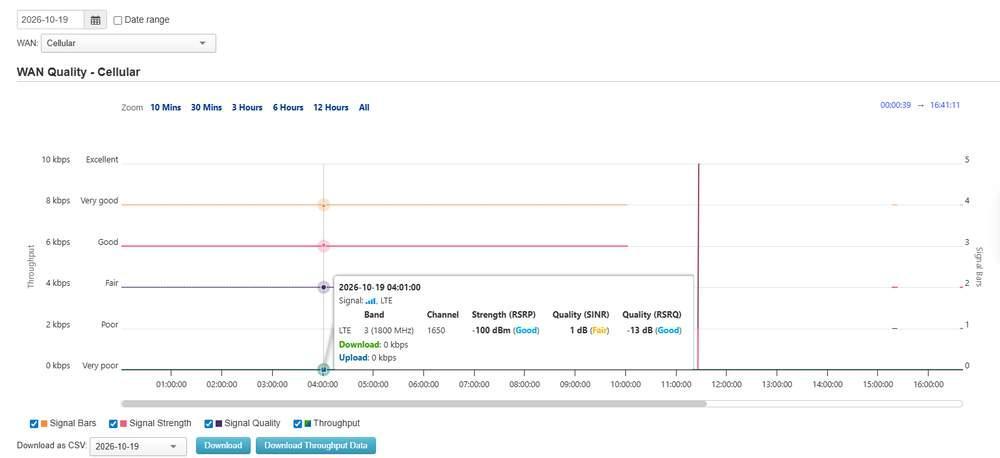
All four series ticked. The hover box adds Download and Upload below the signal table, and the Throughput axis in kbps is on the far left.
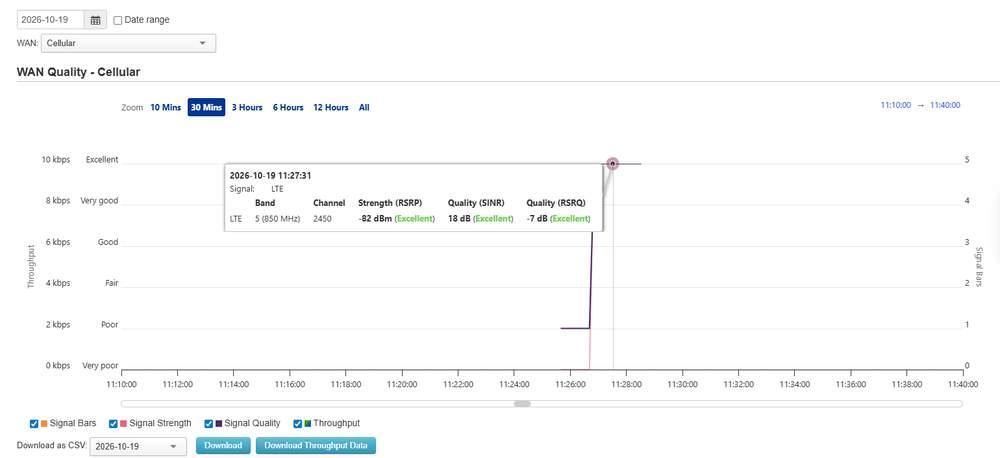
30 Mins zoom. Signal Quality rises from Poor to Excellent as the radio moves to band 5 (850 MHz). The hover box shows the exact sample time, with Excellent for RSRP, SINR and RSRQ.
To examine a short event, select a zoom level such as 30 Mins, then drag the scrollbar below the time axis to the required time. The start and end fields at the top right show the span in view.
To mark a span, drag across the chart. The span is shaded grey and labelled with its start and end time, which shows the length of a weak signal period. Click outside the shaded span to clear it.
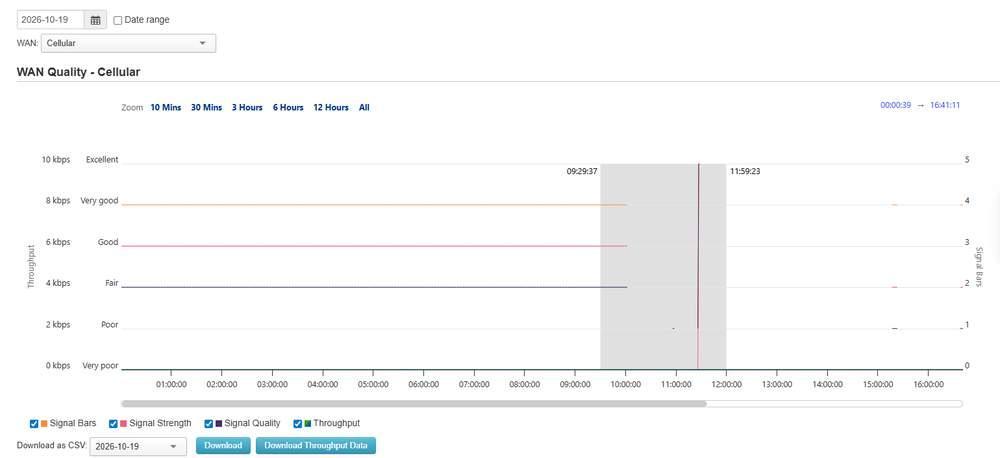
A span marked by dragging, shaded grey and labelled 09:29:37 and 11:59:23 at its edges. The Zoom row and the scrollbar set the zoom.
Compare the signal series with Connection Up/Down History for the same WAN. A drop that follows a fall to Poor or Very poor indicates that signal was the cause.
A cellular WAN that has not reported signal values shows No data available for the signal series.
15.6.5. Controls on This Screen
Control | What it does |
WAN: | Selects the connection to chart |
Zoom | Sets the time span shown in the chart |
Throughput | Overlays per minute bandwidth on the chart, so that a latency rise can be compared with the traffic on the link at the time. Its tooltip states that the data source is Per-minute Reports. Download Throughput Data uses the same per minute source |
Zoom time fields | Set the start and end of the span the chart covers |
Date picker | Sets the day shown on the chart. Pre-filled with the current date, in the format YYYY-MM-DD |
Date range | Charts a range of days instead of a single day |
Signal Bars, Signal Strength, Signal Quality | Plot cellular signal series. Available only when a cellular WAN with signal data is selected |
Download as CSV: selector | Offers the date chosen in the date picker, then the months for which the device has data. It applies to the CSV export only, not to the chart |
Download | Exports the WAN quality data for the selected WAN and the chosen date or month as CSV. In the Download as CSV: row at the bottom of the screen |
Download Throughput Data | Exports per minute bandwidth data for the selected WAN, covering the selected date from 00:00:00 to 23:59:59, as CSV. Beside Download |
15.7. Bandwidth and Usage Reports
Shows live throughput and historical data usage for the device, per WAN or across all WANs.
Every view except Real-Time has a Download as CSV link at the bottom of the screen. To export per minute bandwidth for a single day, Download Throughput Data on WAN Quality Reports (15.6 WAN Quality Reports) is an alternative. To export historical usage as a table, use Group > Reports > Usage Reports (11.4 Usage Reports), which offers the same Hourly, Daily and Monthly granularities across the group. For quotas and alerts across multiple SIMs, use Group > Reports > SIM Card Reports (11.5 SIM Card Reports (Group Level)).
Where to find it
Device > Reports > Bandwidth and Usage Reports
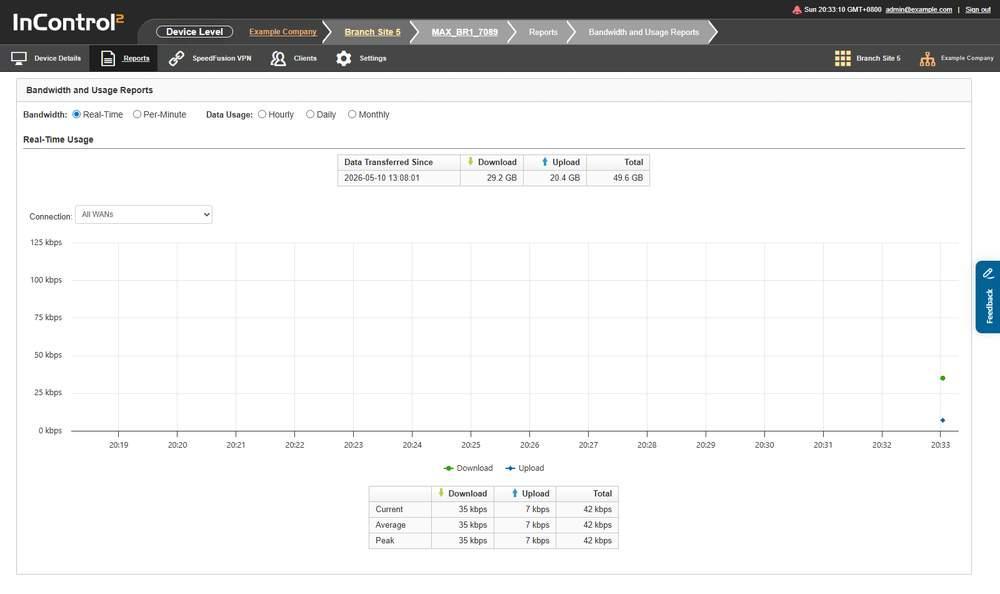
Bandwidth and Usage Reports on the Real-Time setting. The two radio button groups at the top switch between live bandwidth and historical usage.
15.7.1. Choosing the View
Two radio button groups are at the top of the page. They share one setting, so only one option across both groups is active at a time.
Group | Options |
Bandwidth: | Real-Time, Per-Minute |
Data Usage: | Hourly, Daily, Monthly |
Real-Time is selected when the screen loads and is described below. The radio buttons set the granularity:
- Real-Time, Hourly, Daily and Monthly have no date selector.
- Hourly covers about the last 24 hours, Daily about the last 45 days and Monthly the last 24 months.
- Per-Minute adds a date field and From and To times for a single day.
15.7.2. Real-Time Usage
A summary row is at the top of the section.

The summary row. Download, Upload and Total are running totals counted from the timestamp under Data Transferred Since.
Column | What it shows |
Data Transferred Since | The timestamp the running totals count from |
Download | Total downloaded since that timestamp |
Upload | Total uploaded since that timestamp |
Total | Download plus upload |
Below it, a live chart plots Download and Upload in kbps across the last few minutes, followed by a three row table.
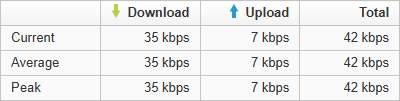
The table below the live chart. Current, Average and Peak each show Download, Upload and Total in kbps.
Row | What it shows |
Current | Throughput at the latest sample |
Average | Average throughput across the charted period |
Peak | Highest throughput in the charted period |
Each row has Download, Upload and Total columns.
15.7.3. Controls on This Screen
Control | What it does |
Real-Time | Shows live throughput |
Per-Minute | Shows bandwidth at per minute granularity |
Hourly | Shows data usage by hour |
Daily | Shows data usage by day |
Monthly | Shows data usage by month, for the last 24 months. To check data usage on a metered link, select Monthly and the SIM slot in Connection: |
Connection: | Filters the view to one WAN. Example options: All WANs, WAN, Cellular, Wi-Fi WAN on 2.4 GHz, Wi-Fi WAN on 5 GHz, VLAN WAN 1. The list is built from the device's WAN connections and differs by device. The Data Usage views also list individual SIM slots and SpeedFusion profiles |
15.8. Captive Portal Reports (Device Level)
Shows guest access through the captive portal on the device that runs it.
Where to find it
Device > Reports > Captive Portal Reports
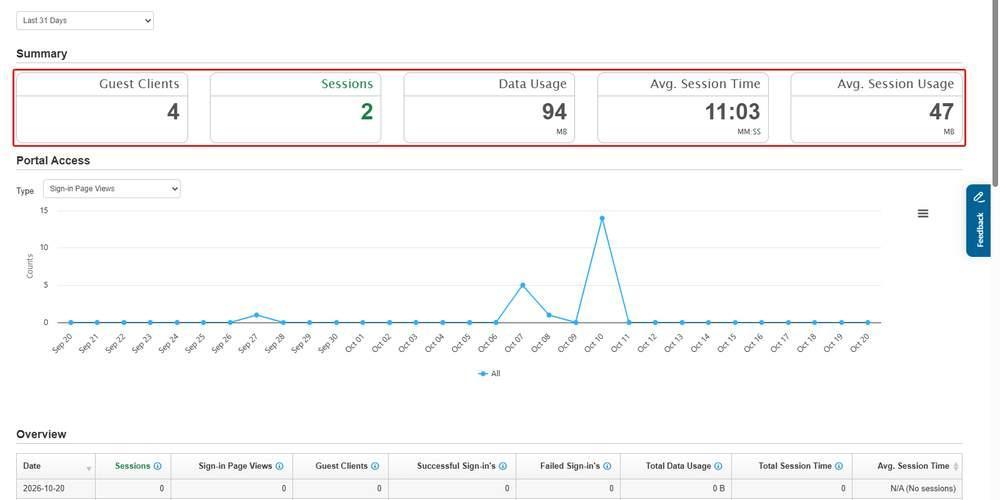
Captive Portal Reports on a device that runs a captive portal, with Last 31 Days selected. The Summary tiles, outlined in red, show the period totals, here 4 guest clients, 2 sessions and 94 MB. The Portal Access chart, set to Sign-in Page Views, shows the days on which the portal was used.
15.8.1. Choosing the Date Range
The date range selector offers five options:
- Today
- Yesterday
- Last 7 Days
- Last 31 Days
- Custom
The longest preset is Last 31 Days, at both group and device level. With Custom, the date picker reaches back about 92 days.
15.8.2. What This Screen Shows
Five sections. On a device with no portal activity, each shows No data available.
Section | What it reports |
Summary | Headline portal figures for the range |
Portal Access | Portal access activity across the range |
Overview | Overview of portal usage |
Client Types | Breakdown of the client types that used the portal |
Visits in Each Access Mode | Visit counts by the access mode used to sign in |
Below them, a Guest User Information Download area contains a single link, Group level Captive Portal Reports. There is no guest user export on this screen. When the device has portal activity, Overview, Client Types and Visits in Each Access Mode each have a Download as CSV link.
15.8.3. Portal Data Appears on the Device Running the Portal
Only the device running the captive portal shows data here. Other devices in the group show No data available. When more than one device in the group runs a portal, the group report shows the combined total. The columns and chart series of each section are described for the group-level screen in the Reports chapter. See 11.9 Captive Portal Reports (Group Level).
For portal activity across the group, including the guest user export, go to Group > Reports > Captive Portal Reports.
15.8.4. Controls on This Screen
Control | What it does |
Date range selector | Sets the reporting period for the page. Today, Yesterday, Last 7 Days, Last 31 Days, Custom |
Group level Captive Portal Reports | Opens the captive portal report for the whole group, covering every device in it. Guest user details are downloaded there, from the Download as CSV link in its Guest User Information Download section |
15.9. Event Log (Device Level)
Lists the events the device reported, with its offline and online history and an archive download.
For events across every device in the group, use Group > Reports > Event Log (11.11 Event Log (Group Level)). For changes made by administrators, with old and new values, use Group > Settings > Operation Log (13.18 Operation Log (Group Level)).
Where to find it
Device > Reports > Event Log
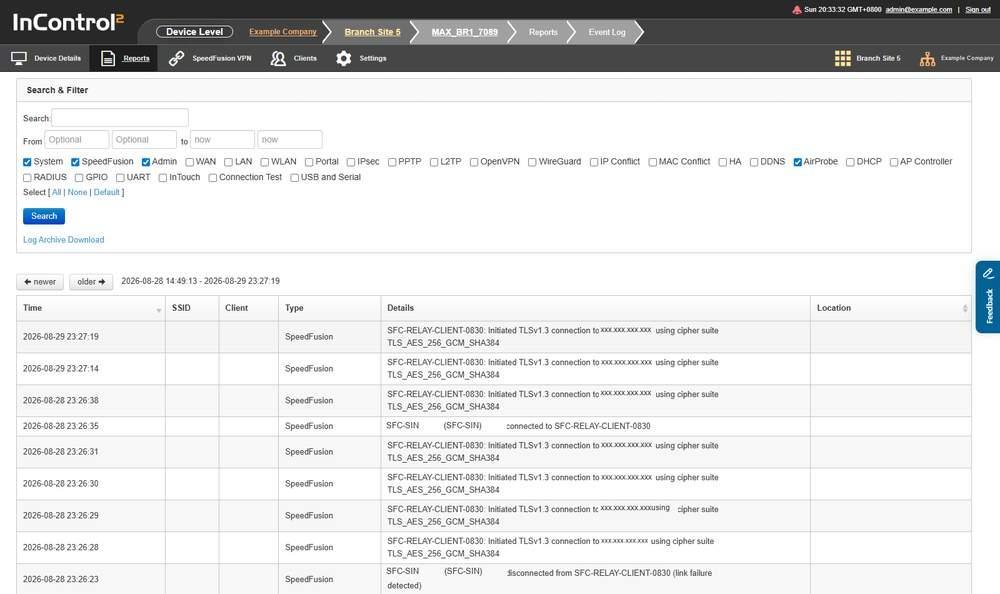
The Event Log. The Search & Filter panel is above the results, and the newer and older buttons page through them.
15.9.1. Search & Filter

The Search & Filter panel when opened. System, SpeedFusion, Admin and AirProbe are ticked, and Log Archive Download is below the Search button.
Field | What it does |
Search: | Free text match against the log. Marked Optional |
From ... to | Start and end of the search period. The end field defaults to now. The fields are limited to the rolling 31 day search window. For older events, download the archive for the relevant month |
Category checkboxes | Limit the search to the selected event categories |
Select [ All | None | Default ] | Ticks every category, clears every category, or applies the default selection |
Search | Runs the search |
The category checkboxes are:
- System
- SpeedFusion
- Admin
- WAN
- LAN
- WLAN
- Portal
- IPsec
- PPTP
- L2TP
- OpenVPN
- WireGuard
- IP Conflict
- MAC Conflict
- HA
- DDNS
- AirProbe
- DHCP
- AP Controller
- RADIUS
- GPIO
- UART
- InTouch
- Connection Test
- USB and Serial
When the Event Log opens, four categories are ticked:
- System
- SpeedFusion
- Admin
- AirProbe
WAN, Connection Test and LAN are not in the default selection. To include link events in a search, tick WAN, or use All, then click Search.
The category list differs from the group level Event Log. This screen adds AirProbe and UART, and ticks AirProbe with System, SpeedFusion and Admin when it loads.
15.9.2. The Results Grid
Above the grid, InControl 2 shows the timestamp range displayed, from the oldest to the newest entry on the page.
Column | What it shows |
Time | Timestamp of the event |
SSID | SSID the event relates to, where applicable |
Client | Client the event relates to, where applicable |
Type | The event category, matching the filter checkboxes |
Details | The event text as reported by the device, including peer names, serial numbers and IP addresses. Treat exports of this column as sensitive |
Location | The device's latitude and longitude at the time. Opens the position on Google Maps, a third-party service outside InControl 2 |
Download as CSV on the results grid exports up to 1000 events from the last 7 days of the specified time period, as stated by its information icon. For a complete record, use Log Archive Download.
The export includes only the categories used in the last search. Ticking a category has no effect until Search is clicked, so tick the additional categories, click Search, then download. The default categories are System, SpeedFusion, Admin and AirProbe.
15.9.3. Offline History and Online History
A second table at the bottom of the page records periods when the device was offline.

The offline and online history table. Each row pairs an Offline Time with the matching Online Time and the length of the gap.
Column | What it shows |
Offline Time | When the device went offline |
Online Time | When the device came back online |
Duration | Length of the offline period |
15.9.4. Log Archive Download
A link that retrieves an archived log file instead of searching the live log. Log Archive Download opens a dialog that lists the months in the archive. Each month expands to an All entry above the individual days, with the size of each.
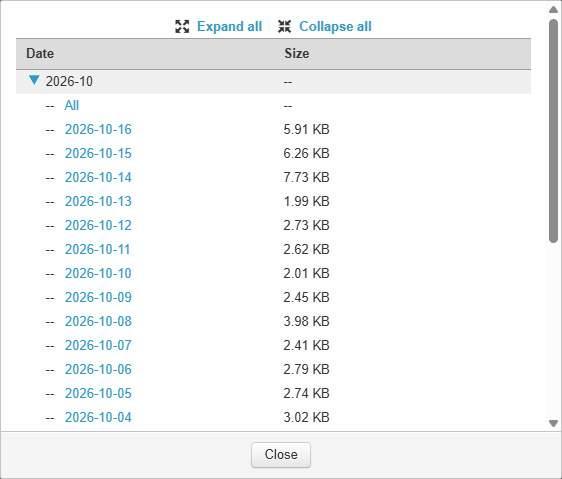
The Log Archive Download dialog opened from the device Event Log. The current month is expanded, with an All entry above the individual days and the size of each.
Search and archive download have different retention windows. Event Log search covers a rolling 31 days. Log Archive Download covers a rolling 24 months.
- The dialog lists the last 12 months. The group-level dialog reaches back 24 months (11.11.6 The Log Archive Download Dialog).
- The most recent days are not yet available as an archive. The archive typically lags about 3 days behind the present, so use search for recent events.
The group level Event Log opens a similar dialog, which lists every month in the archive, expandable to the individual days available for download. See the Reports chapter (11.11.6 The Log Archive Download Dialog).
15.9.5. Controls on This Screen
Control | What it does |
Search | Runs the search with the current filter |
Select [ All | None | Default ] | Sets all category checkboxes at once |
newer | Pages towards more recent entries |
older | Pages towards older entries |
Download as CSV | Exports the section above it. Available on both the results grid and the offline and online history table |
Log Archive Download | Opens the archive dialog. Select All under a month, or a single day |
15.10. Firewall Log
Shows which firewall rule allowed or denied a packet on the device.
Firewall logging must be enabled before entries appear here. It is set in Group > Network Settings > Firewall Rules, in the Intrusion Detection and DoS Prevention section of the rule set (8.5.7 Intrusion Detection and DoS Prevention), where Logging is separate from Enable. A device whose rule set has logging off shows No data available for every date.
Where to find it
Device > Reports > Firewall Log
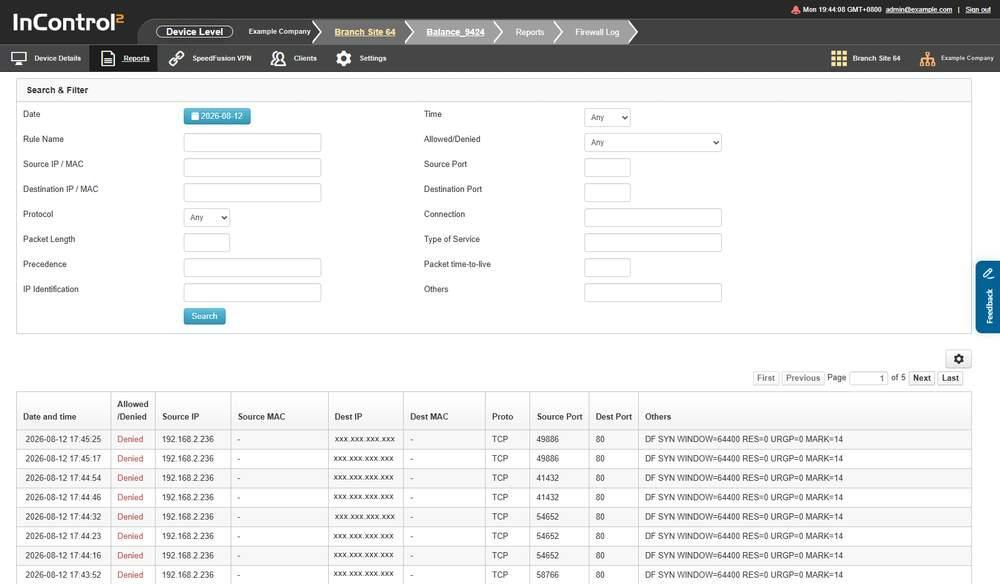
The Firewall Log with entries. The Search & Filter panel is above the results, and the paging controls and Download as CSV are below them.
15.10.1. One Day at a Time
This screen reports a single day. Date is a button showing the selected day, in the format YYYY-MM-DD, and Time limits that day to one hour. There is no date range selector and no multi day view.
15.10.2. Search & Filter
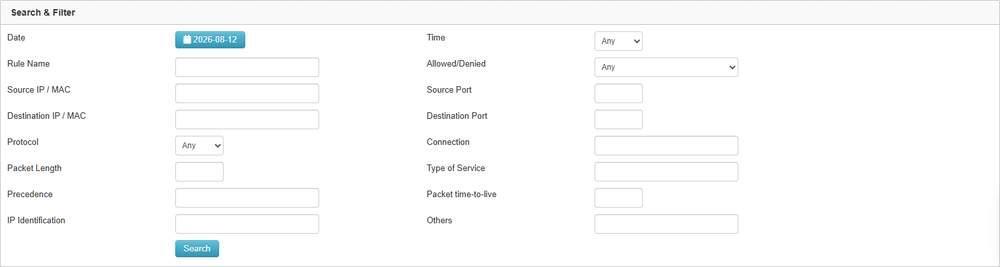
The Search & Filter panel. Date and Time set the period, and the other fields filter the packets shown.
Field | What it filters on |
Date | The day to report on |
Time | Any, or one hour of that day on the hour, from 00:00 to 23:00 |
Rule Name | The name of the firewall rule that logged the packet |
Allowed/Denied | Any, Allowed or Denied |
Source IP / MAC | Source address of the packet |
Source Port | Source port |
Destination IP / MAC | Destination address of the packet |
Destination Port | Destination port |
Protocol | Any, TCP, UDP, ICMP or IP |
Connection | The connection the packet arrived on |
Packet Length | Packet length |
Type of Service | The type of service value |
Precedence | The precedence value |
Packet time-to-live | The TTL value |
IP Identification | The IP identification value |
Others | Free text match against the Others column |
Search applies the filter. The three dropdowns default to Any.
15.10.3. The Results Table
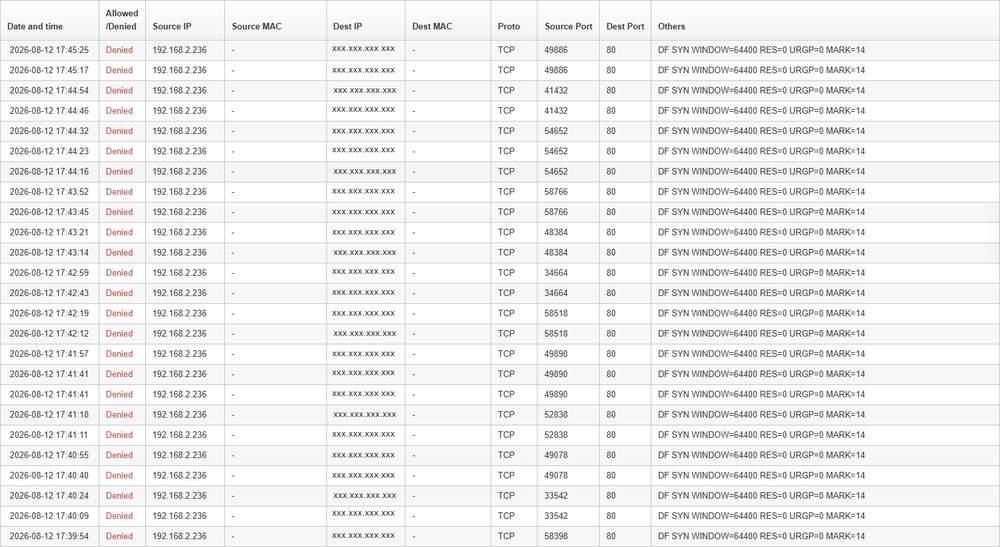
Firewall Log results. Each row is one logged packet, with Allowed/Denied in the second column and the TCP flags and other packet details under Others.
Column | What it shows |
Date and time | When the packet was logged |
Allowed/Denied | Whether the rule allowed or denied the packet |
Source IP | Source address |
Source MAC | Source MAC address. A dash means none was recorded |
Dest IP | Destination address |
Dest MAC | Destination MAC address. A dash means none was recorded |
Proto | Protocol, for example TCP |
Source Port | Source port |
Dest Port | Destination port |
Others | The remaining packet details as reported by the device, including flags, window size and mark. Treat exports of this column, and of the address columns, as sensitive |
Above and below the table, InControl 2 shows the range displayed, in the form Showing 1 to 25 of N entries. The table is paged with First, Previous, a Page field, of, Next and Last. Twenty five rows are shown per page. Paging is per day, and a busy device can fill several pages for one date, so check the entry count.
15.10.4. Controls on This Screen
Control | What it does |
Date | Opens the day selection for the report |
Search | Applies the filter set above |
First, Previous, Page, Next, Last | Page through the results |
Download as CSV | Exports the log for the selected date. The export applies the filters set with Search, for example a Source Port value, as well as the selected date |
15.11. Content Blocking Log
Shows which mechanism and category blocked a request on this device.
Content Blocking is configured as a tab in the firewall rule set editor at group level, not as a menu item (see 8.5.8 The Content Blocking Tab). This screen reports what that policy blocked.
Where to find it
Device > Reports > Content Blocking Log
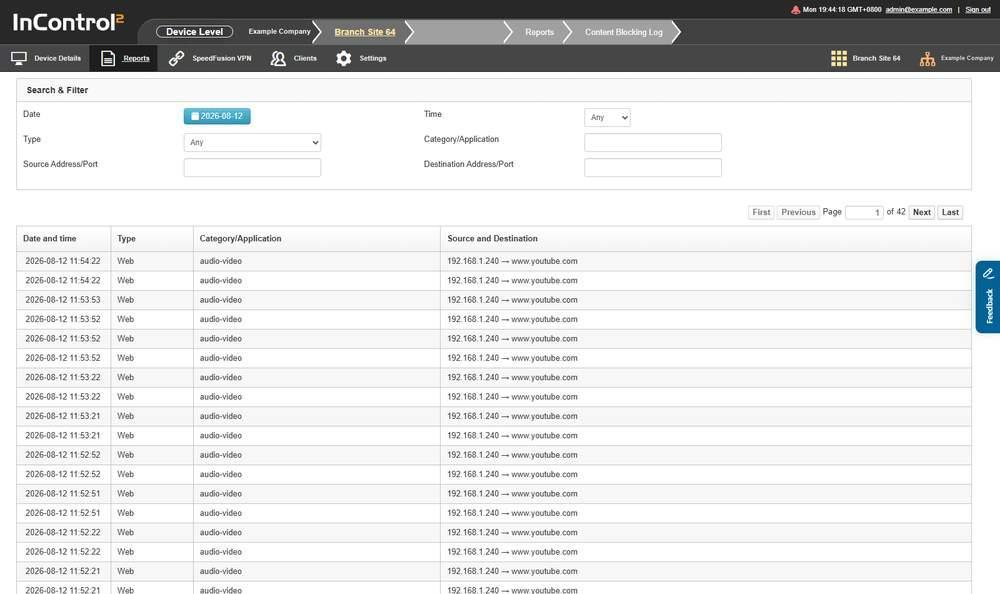
The Content Blocking Log with entries. Each row is one blocked request, with the category that blocked it and the client that made the request.
15.11.1. One Day at a Time
This screen reports a single day, with the same Date and Time controls as the Firewall Log (15.10.1 One Day at a Time). There is no date range selector. A device with no blocked requests on the selected date shows No data available.
15.11.2. Search & Filter

The Search & Filter panel. Type selects the blocking mechanism to list, and the address fields filter the rows to one client or destination.
Field | What it filters on |
Date | The day to report on |
Time | Any, or one hour of that day on the hour, from 00:00 to 23:00 |
Type | Any, Application, Web or PrimeCare Secure DNS |
Category/Application | The category or application the request was matched to |
Source Address/Port | The client that made the request |
Destination Address/Port | The requested destination |
Type selects one of three separate blocking mechanisms: Application, Web and PrimeCare Secure DNS. Any lists all three together. Because PrimeCare Secure DNS blocking is logged here with application and web category blocking, the log covers more than the content categories in the rule set.
15.11.3. The Results Table
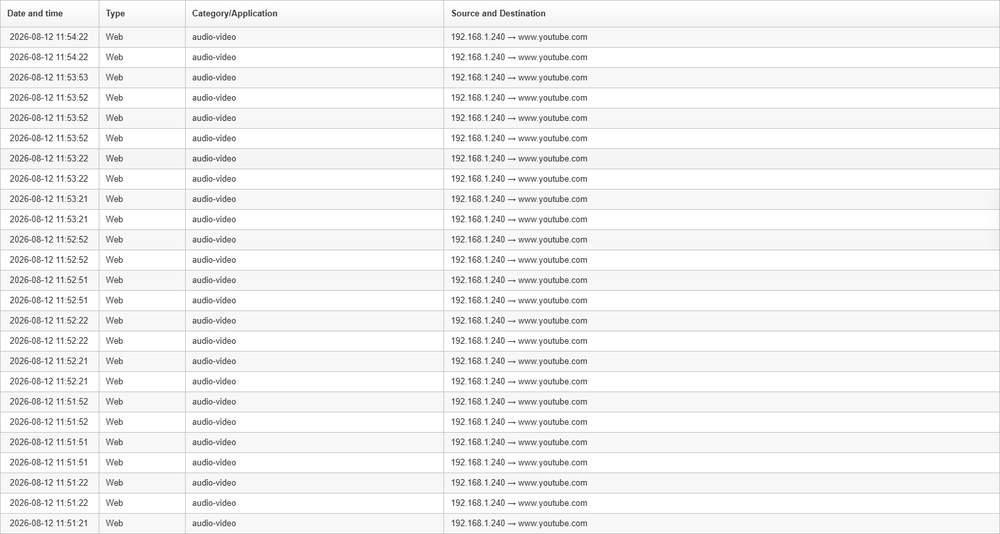
Content Blocking Log results. Category/Application uses the lower case form audio-video, and Source and Destination shows the client address and the requested site separated by an arrow.
Column | What it shows |
Date and time | When the request was blocked |
Type | The blocking mechanism, matching the Type filter |
Category/Application | The category or application responsible, shown in lower case, for example audio-video for the Audio-Video category |
Source and Destination | The client address and the requested destination, separated by an arrow |
Categories in this log:
- The rule set editor lists all 17 content categories regardless of the licence tier on the device. A device with the Lite tier of web content filtering enforces only its 6 categories, and entries in this log are limited to those 6. The device firmware applies this limit, not InControl 2.
- InControl 2 uses the label Contraband where the device web interface uses Abused Drugs.
The table is paged with First, Previous, a Page field, of, Next and Last, and shows the range displayed in the form Showing 1 to 25 of N entries.
15.11.4. Controls on This Screen
Control | What it does |
Date | Opens the day selection for the report |
Type | Limits the log to one blocking mechanism |
First, Previous, Page, Next, Last | Page through the results |
Download as CSV | Exports the log |
15.12. Connection Up/Down History
Lists every transition of a WAN connection or a SpeedFusion VPN profile between up and down, with a monthly availability summary.
Where to find it
Device > Reports > Connection Up/Down History
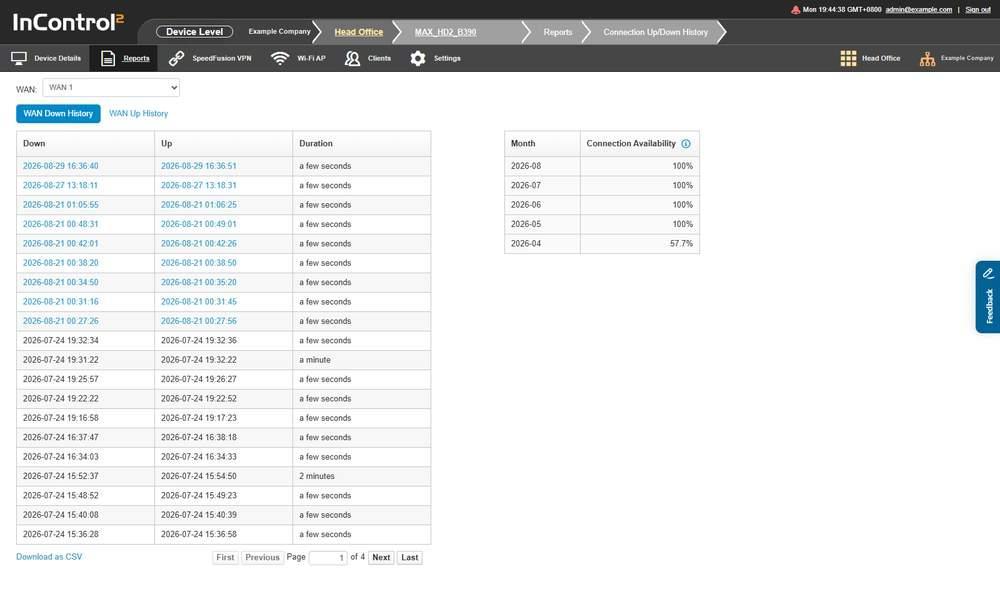
Connection Up/Down History on the WAN tab. The WAN selector is above the transition table, and the monthly availability table is at the bottom.
15.12.1. Tabs
Tab | Covers |
WAN | Transitions of the device's WAN connections. Active by default |
SpeedFusion VPN | Transitions of SpeedFusion VPN connections |
Both tabs are panels on the same page. A device with no SpeedFusion VPN profile shows the WAN panel only, with no tabs.
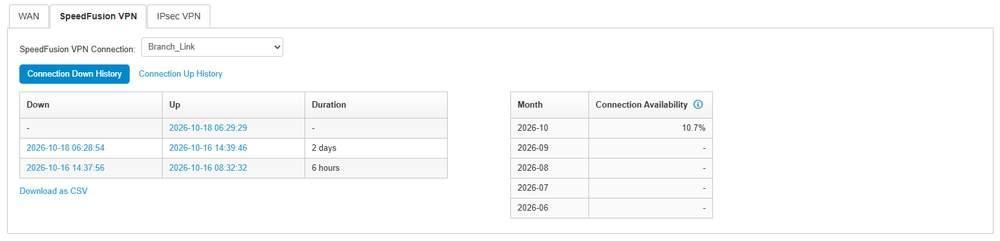
The SpeedFusion VPN tab with one connection selected. The transition table is on the left and the monthly availability table on the right.
The SpeedFusion VPN panel has the same layout as the WAN panel.
Element | What it does |
SpeedFusion VPN Connection | Selects the connection to report on. Lists the device's SpeedFusion VPN connections by name |
Connection Down History | Lists transitions with the columns Down, Up and Duration. The panel opens on this view |
Connection Up History | Lists the same transitions with the columns Up, Down and Duration |
Timestamp links | Open the Event Log filtered to a ten minute window around that transition |
Download as CSV | Exports the transition table for the selected connection |
Month, Connection Availability | The monthly availability table, with the same information icon as the WAN panel |
A device with IPsec VPN connections shows a third tab, IPsec VPN, with the same layout and an IPsec VPN Connection: selector.
15.12.2. The Transition Table
Two view controls, WAN Down History and WAN Up History, are above a single table. The page opens on WAN Down History.
Column | What it shows |
Down | When the connection went down. Opens the Event Log around that time |
Up | When the connection came back up. Opens the Event Log around that time. A dash means it has not yet returned |
Duration | Length of the outage, as a rounded value in words such as a few seconds, 2 minutes, a day, a month. For exact durations, use the Down and Up timestamps |
Selecting a timestamp opens the Event Log filtered to a ten minute window around it, with System and WAN ticked.
Timestamps from about the last five weeks are links. Older transitions remain listed, with their timestamps shown as plain text.
The table is paged. Controls are First, Previous, a Page number field, Next and Last.
15.12.3. Monthly Availability
A second table below summarises availability per month, per WAN or per SpeedFusion VPN connection. Download as CSV exports the transition table for the selected connection.
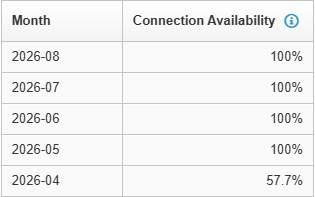
The monthly availability table, newest month first. The information icon beside Connection Availability shows the formula and the note on offline devices.
Column | What it shows |
Month | The month, as YYYY-MM |
Connection Availability | Percentage of the month the connection was up. A dash means no data for that month, which is different from zero percent availability. Zero percent is shown as 0% |
The table covers a rolling five month window, newest first, ending at the current month.
The information icon gives the formula and a condition:
- Availability for a month is the connection's uptime in seconds in the month, divided by the number of seconds elapsed in the month.
- While the device is offline, InControl 2 does not treat its connections as down until the device comes back online and reports that it has rebooted.
As a result, a device that was powered off does not accrue connection downtime for that period until it returns and reports in. Availability figures can therefore change after an outage.
15.12.4. Controls on This Screen
Control | What it does |
WAN | Switches to the WAN history panel |
SpeedFusion VPN | Switches to the SpeedFusion VPN history panel |
WAN: | Selects the connection to report on, for example VLAN WAN 1 and WAN. Only connections with transition history are listed |
First, Previous, Page, Next, Last | Page through the transition table |
Download as CSV | Exports the transition table for the selected connection, sorted by the down timestamp |
Timestamp links | Open the Event Log filtered to a ten minute window around that transition |
15.13. AirMonitor Reports
Shows channel utilization and the access points detected around the device. For other wireless information, use Site Survey for recorded scans and Wi-Fi Reports for client and SSID activity.
The device menu varies by product type and device state. A device without monitoring data shows No data available on this screen.
Where to find it
Device > Reports > AirMonitor Reports
15.13.1. What This Screen Shows
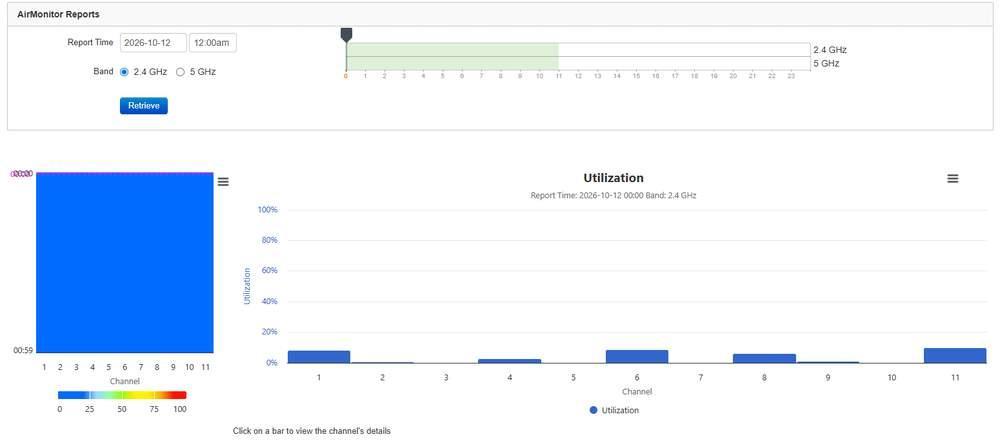
AirMonitor Reports on an access point with monitoring data. Report Time, Band and Retrieve are above the hour timeline, with the channel heat map and the Utilization chart below.
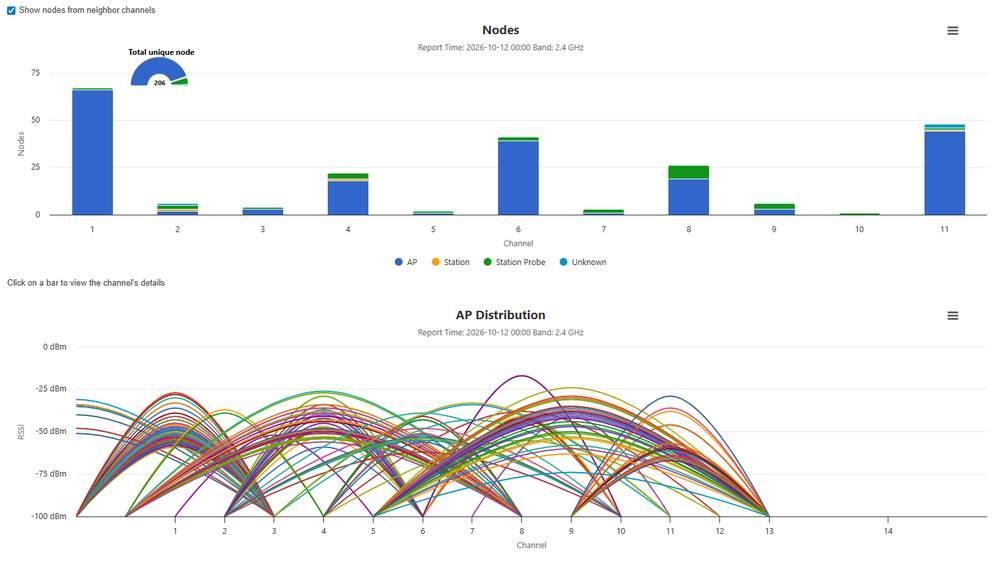
The lower half of the same report. Nodes stacks AP, Station, Station Probe and Unknown per channel beside the Total unique node gauge, and AP Distribution plots RSSI by channel.
On a device with monitoring data, the screen reports the radio environment for one hour of one day on one band.
Section | What it shows |
Report Time | A date field and a time field |
Band | 2.4 GHz or 5 GHz |
Retrieve | Loads the report for the selected time and band |
Timeline | Hours 0 to 23 of the selected day, with a row for each band. The slider handle marks the hour reported |
Channel heat map | Channels across and minutes 00:00 to 00:59 down, coloured on a scale of 0 to 100 |
Utilization | Utilization per channel as a percentage. The subtitle shows the report time and band |
Nodes | Nodes detected per channel, stacked as AP, Station, Station Probe and Unknown, with a Total unique node gauge |
AP Distribution | One curve per access point detected, plotted by channel against RSSI from -100 dBm to 0 dBm |
- Utilization and Nodes both show the line Click on a bar to view the channel's details.
- Show nodes from neighbor channels is a checkbox above Nodes.
- Each chart has a menu icon in its top right corner.
- On a device without monitoring data, the screen shows No data available, either alone or below the Report Time and Band controls. This is expected and does not indicate a fault.
15.14. How the Reports Menu Fits Together
- Several reports need a selection before they show data. SpeedFusion Score and Site Survey select defaults when opened without a selection: SpeedFusion Score shows today's latest score for one of the device's profiles, and Site Survey lists the latest day with scans. WAN Quality Reports shows data once a WAN and a date are selected.
- The device menu varies by product type and device state, so not every report is listed on every device.
- On an offline device, Device Tools, Remote Web Admin and Web CLI are greyed out in the Settings menu. Reports remain available.
- When a device is offline: see Event Log, Offline History and Online History (15.9.3 Offline History and Online History), for when it went offline; Connection Up/Down History (15.12 Connection Up/Down History) for which WAN dropped first; and Device Reports Device Availability for whether it lost power. Connection downtime is not counted until the device returns and reports a reboot.
- Retention differs by report family and by level. Device-level reports offer at least five ranges, and the longer ranges vary by device. At group level, Device Reports and Wi-Fi Reports always offer Last 182 Days and Last 12 Months. Captive Portal Reports has Last 31 Days as its longest preset and a Custom range of about 92 days. Event Log search covers a rolling 31 days, and Log Archive Download a rolling 12 months at device level and 24 months at group level.
- Exports differ by screen. Device Reports and Wi-Fi Reports export each section for the selected date range. WAN Quality Reports and both log screens export a single day. The Event Log export covers up to 1000 events in the last 7 days of the period. DPI Reports, Bandwidth and Usage Reports and Site Survey have no export.
- Firewall Log and Content Blocking Log report by day, not by range. Each reports one date, optionally limited to one hour. Neither has a date range selector, so a longer period must be reviewed one day at a time.
- Some screens contain data only on certain devices. AirMonitor Reports contains data only on access points with monitoring data. Captive Portal Reports shows data only on the device running the portal. Captive portal activity for the whole group is reported at group level (11.9 Captive Portal Reports (Group Level)).
- There is no retention setting in Organization Settings. An organization is removed 28 days after its last device is deleted. See 9.8.13 Organization Removal.