
12. Clients
The Clients page lists connected devices, along with their addresses, connection details and current traffic rates. The list is available at two levels: group level covers every device in the group, and device level covers one device. The two levels differ in one column and one control.
For client counts over a period and top clients by usage across the group, see Device Reports (11.2 Device Reports (Group Level)) and Wi-Fi Reports (11.3 Wi-Fi Reports (Group Level)) in the Reports chapter. For one device, see Top Clients by Usage (15.2.4 Top Clients by Usage) and DPI Reports (15.4 DPI Reports) in the Device Reports chapter, which show that device's heaviest clients and its traffic by application category.
12.1. Clients (Group Level)
Use this screen to locate a client within the group and see how it is connected.
Lists the clients currently connected across all devices in the group. For the clients that used the most data over a past period, use Top Clients by Usage in Device Reports.
To locate a client, enter it in Search:. Device shows the device it is attached to, and SSID, Band and Signal show how it is connected. To see the Port, open that device and go to Device > Clients. See 12.2 Clients (Device Level).
Where to find it
Group > Clients
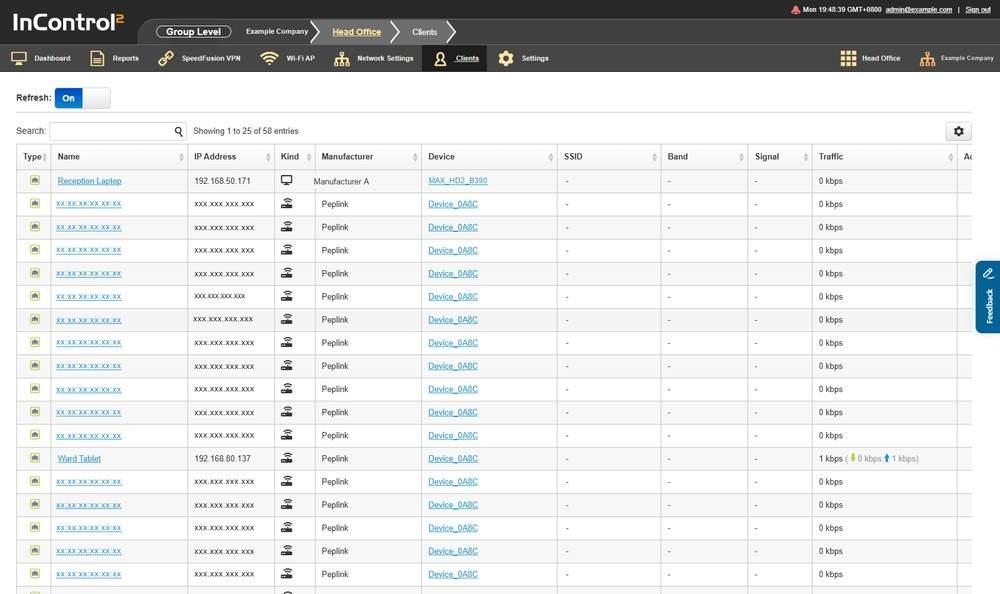
The group level client list. The Device column shows the device each client is connected to.
12.1.1. What This Screen Shows
One row per client. The list is paged and shows the range displayed, for example Showing 1 to 25 of 58 entries. Previous, the page numbers and Next are below the grid.
Column | What it shows |
Type | Shown as an icon. Hover over it to display the text |
Name | The client device's name. Links to that client's entry |
IP Address | The client's IP address |
Kind | Shown as an icon. Hover over it to display the text |
Manufacturer | The manufacturer identified for the client |
Device | The Peplink device the client is connected to |
SSID | The SSID the client joined, for wireless clients |
Band | The band the client is using, for wireless clients |
Signal | The signal reported for the client |
Traffic | The client's current traffic rate, not a total. Shown as the total rate, then download and upload, for example 5 Mbps (↓4 Mbps ↑72 kbps). An idle client shows 0 kbps. Sort this column to find the busiest client |
Access Mode | The access mode applied to the client |
Action | Per row actions for the client. At group level it contains Monitor |
Type and Kind are displayed as icons and describe how InControl 2 classifies the client. Hover over an icon to display its text.
- Type shows how the client is attached to the network, for example Ethernet.
- Kind shows the type of client, for example Desktop or Network Appliance.
These are examples only. Each column can report other values.
12.1.2. Controls on This Screen
Control | What it does |
Refresh: On Off | Turns automatic refreshing of the list on or off |
Search: | Filters the list |
Monitor | Row action in the Action column, one per client. Adds the client to Client Up/Down/Signal Monitoring. See Monitor and client notifications below |
Edit Note | Opens the note for a client. Located below the grid |
Previous, page numbers, Next | Move through the pages of the list |
Column customization | Opens Column Customization, a Show / Column list for selecting which columns appear. MAC Address is available there and is off by default. Enable it when a client has no name or its IP address changes. Apply to all groups applies the selection to every group, and Reset to Defaults restores the standard columns |
Download as CSV | Exports the list |
Edit Note, the paging links and Download as CSV are located below the grid.
12.1.3. Monitor and Client Notifications
Monitor is a row action in the Action column, one button per client. It adds the client to the Client Up/Down/Signal Monitoring notification.
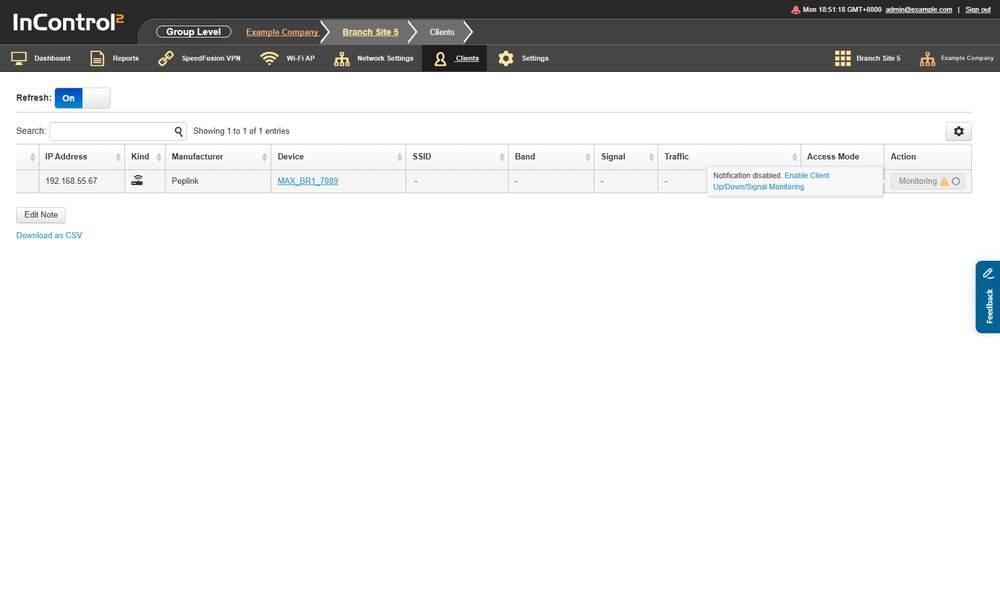
The Action column after Monitor is clicked. The button reads Monitoring with a warning marker, and the tooltip shows the notification as disabled. Edit Note and Download as CSV are below the grid.
- Clicking Monitor changes that row's button to Monitoring.
- If Client Up/Down/Signal Monitoring is disabled in the group's notification settings, the button carries a warning marker and its tooltip reads Notification disabled, followed by the link Enable Client Up/Down/Signal Monitoring, which opens the group's notification settings at that notification.
- To monitor a client, click Monitor on the client's row and enable Client Up/Down/Signal Monitoring in the notification settings. No notification is sent while that setting is disabled.
- Client Up/Down/Signal Monitoring sends a notification when the client's Wi-Fi signal drops below the threshold and another when it recovers. See Notifications in the Settings (Group Level) chapter (13.7 Notifications) for the profile and the delivery channels (e-mail, Pushover, HTTP/S webhook).
Monitor critical clients, such as a point of sale terminal, a payment kiosk or a camera recorder, to receive an alert when the client disconnects while the router remains online.
12.2. Clients (Device Level)
Use this screen to find which port a client is connected to and to set up remote access to equipment behind the device.
Lists the clients on one device.
Where to find it
Device > Clients
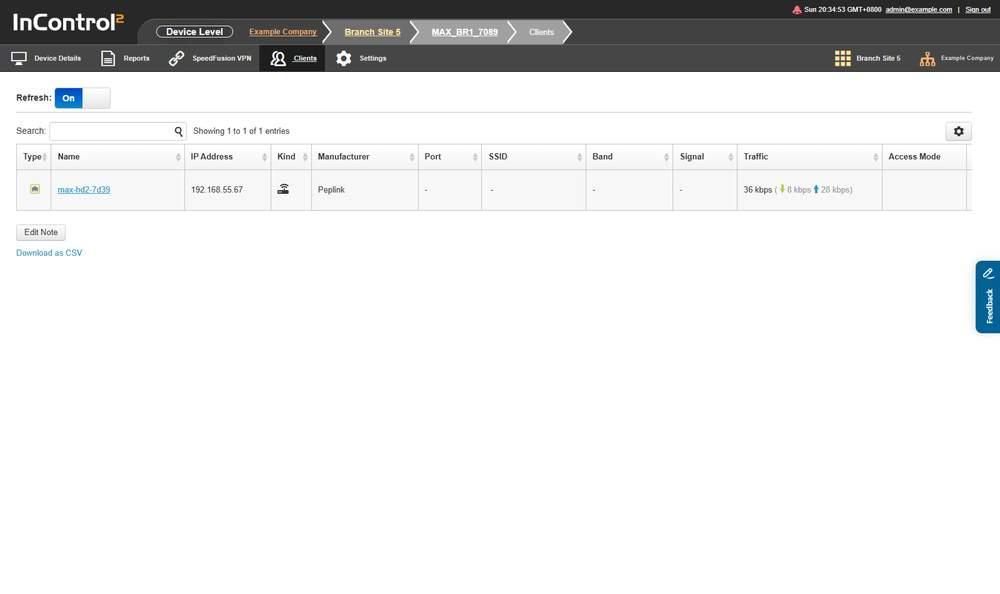
The device level client list. A Port column replaces the Device column, and the InTouch control is in the Action column. Edit Note and Download as CSV are below the list.
12.2.1. How It Differs from the Group-level List
The screen shows the same list, limited to a single device, with the following differences.

A device level client row. The Port column is between Manufacturer and SSID, in the position of the Device column at group level.
Difference | Group level | Device level |
Scope | Every client on every device in the group | Clients on the selected device only |
Sixth column | Device, the device the client is connected to, with a link to it | Port, the port the client is connected to |
Extra row action | Not present | InTouch, beside Monitor in the Action column |
Download as CSV | Exports the group's clients | Exports the device's clients |
All other columns are the same as at group level: Type, Name, IP Address, Kind, Manufacturer, SSID, Band, Signal, Traffic, Access Mode and Action.
At device level, every row belongs to the selected device, so the Port column replaces the Device column.
12.2.2. Controls on This Screen
Control | What it does |
Refresh: On Off | Turns automatic refreshing of the list on or off |
Search: | Filters the list |
InTouch | Row action in the Action column, beside Monitor, on the device-level list only. Adds an InTouch profile for remote management; its tooltip reads Add an InTouch profile for remote management. Use it to access equipment on the LAN behind the router, such as an IP camera or a PLC, from InControl 2. The profile then appears in the InTouch panel on the group Dashboard (10.1.7 The InTouch Panel), where hovering over it shows the Device and the URL on LAN it opens. See InTouch in the Device Level Tools chapter (16.3 InTouch) |
Monitor | Row action in the Action column. Works as at group level, with the same tooltip and the same link to the group notification settings. See Monitor and client notifications (12.1.3 Monitor and Client Notifications) |
Edit Note | Opens the note for a client. Located below the grid, as at group level |
Download as CSV | Exports the list |