
10. Status Tab
The displays available on the Status tab help you monitor device data, client activity, event log, and more.
10.1. Device
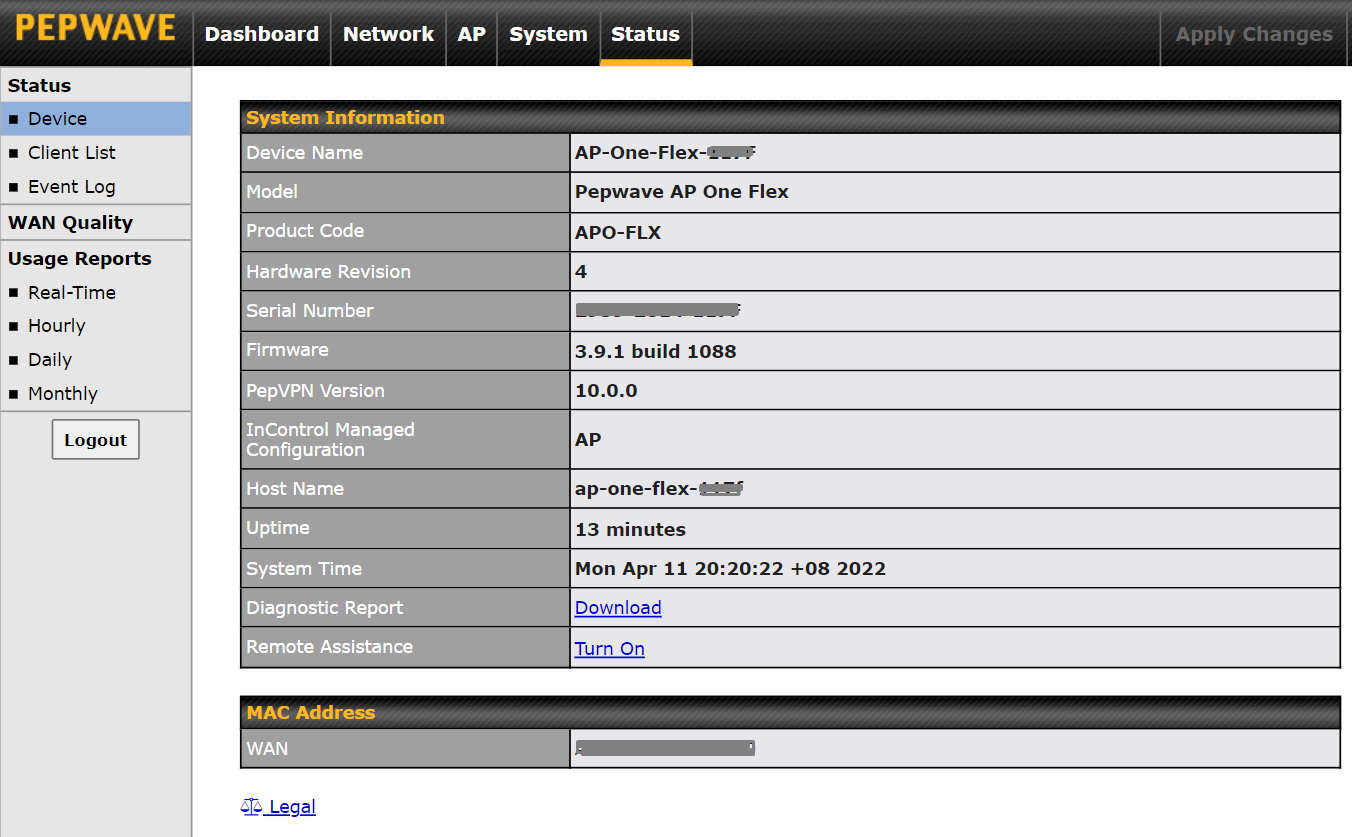
System Information | |
Device Name | This is the name specified in the Device Name field located at System > Admin Security. |
Model | This displays the model of the device. |
Hardware Revision | This displays the hardware version of this device. |
Serial Number | This displays the serial number of this device. |
Firmware | This displays the firmware version this device is currently running. |
PepVPN Version | This displays the current PepVPN version. |
Host name | This displays the hostname of the device. |
Uptime | This displays the length of time since the device has been rebooted. |
System Time | This displays the current system time. |
Diagnostic Report | The Download link is for exporting a diagnostic report file required for system investigation. |
Remote Assistance | Click Turn On to enable remote assistance. |
The second table shows the MAC address of each connected LAN/WAN interface. To view your device’s End User License Agreement (EULA), follow the Legal link.
Important Note |
If you encounter issues and would like to contact the Peplink Support Team (https://contact.peplink.com/secure/create-support-ticket.html), please download the diagnostic report file and attach it along with a description of your issue. |
10.2. Active Session
Information on active sessions can be found at Status > Active Sessions > Overview.
*Please note that the following active session will be available only when your access point is operating in Router Mode.
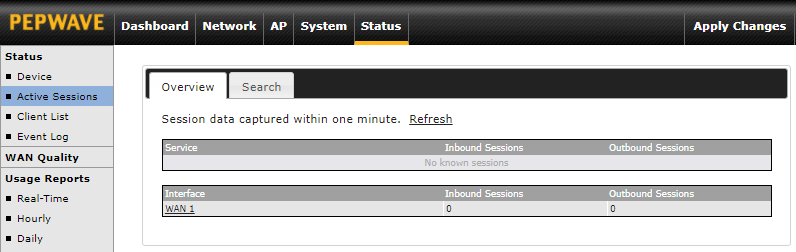
This screen displays the number of sessions initiated by each application. Click on each service listing for additional information. This screen also indicates the number of sessions initiated by each WAN port. In addition, you can see which clients are initiating the most sessions.
You can also perform a filtered search for specific sessions. You can filter by subnet, port, protocol, and interface. To perform a search, navigate to Status > Active Sessions > Search.
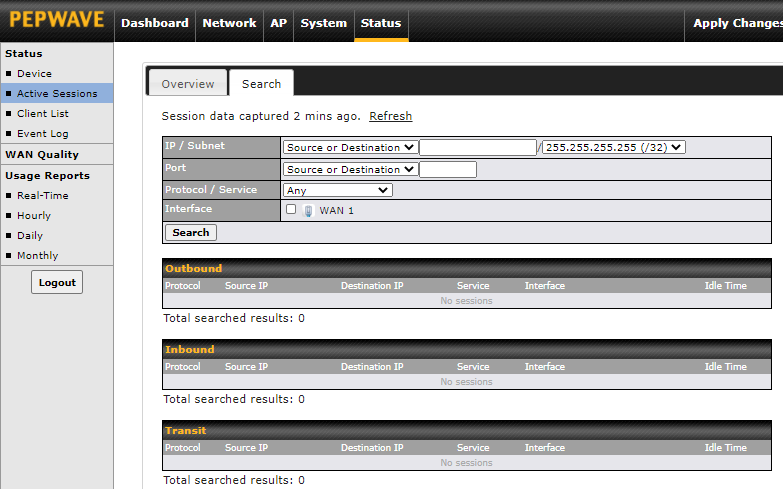
This Active Sessions section displays the active inbound/outbound sessions of each WAN connection on the Peplink router. A filter is available to sort active session information. Enter a keyword in the field or check the box of one of the WAN connections to filter your search.
10.3. Client List
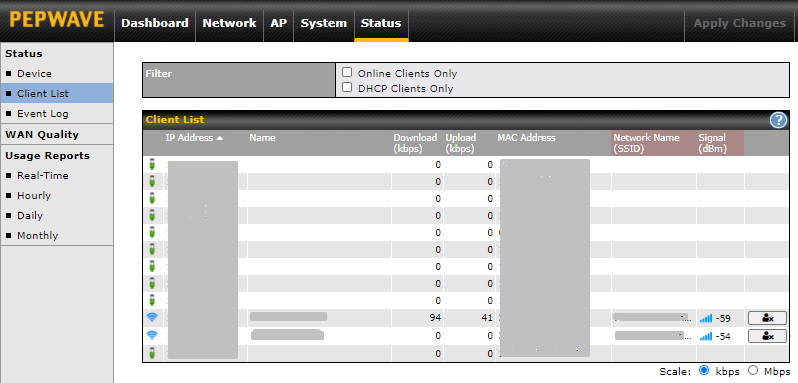
The Client List displays all currently connected clients. It lists DHCP and online client IP addresses, names (retrieved from the DHCP reservation table or defined by users), current download and upload rate, and MAC address.

In the client list table, there is a Ban Client feature which can be used to disconnect Wi-Fi clients by clicking the  button on the right.

There is a blocklist on the same page after you have banned Wi-Fi clients.

You may also unblock Wi-Fi clients when the client devices need to reconnect to the network by clicking the  button on the right.
10.4. Event Log
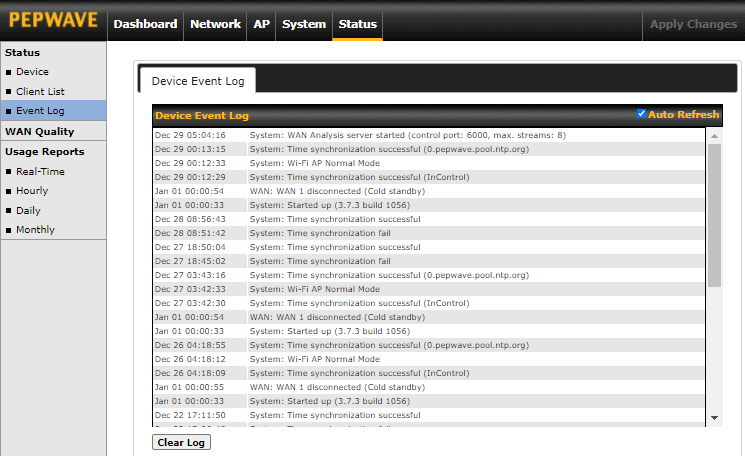
The Event Log displays a list of all events associated with your access point. Check Auto Refresh to refresh log entries automatically. Click the Clear Log button to clear the log.
10.5. WAN Quality
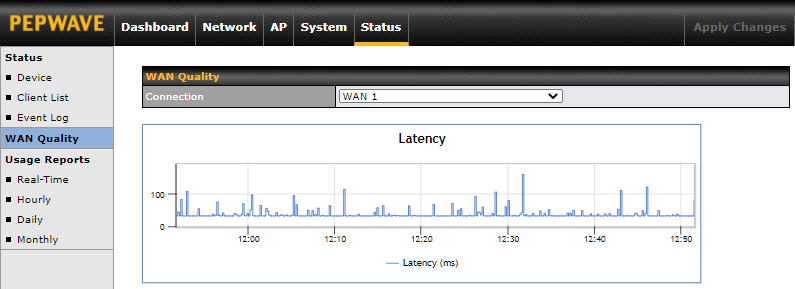
The Status > WAN Quality allows you to select each WAN and view current WAN quality. Detailed information can be seen when selecting a point on the graph.
10.6. Usage Reports
10.6.1. Real-Time
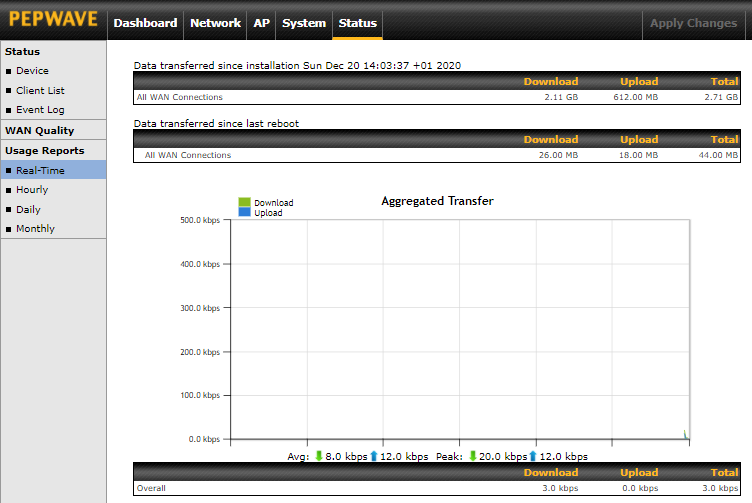
The Data transferred since installation table indicates how much network traffic has been processed by the device since the first bootup. The Data transferred since last reboot table indicates how much network traffic has been processed by the device since the last boot up.
10.6.2. Hourly
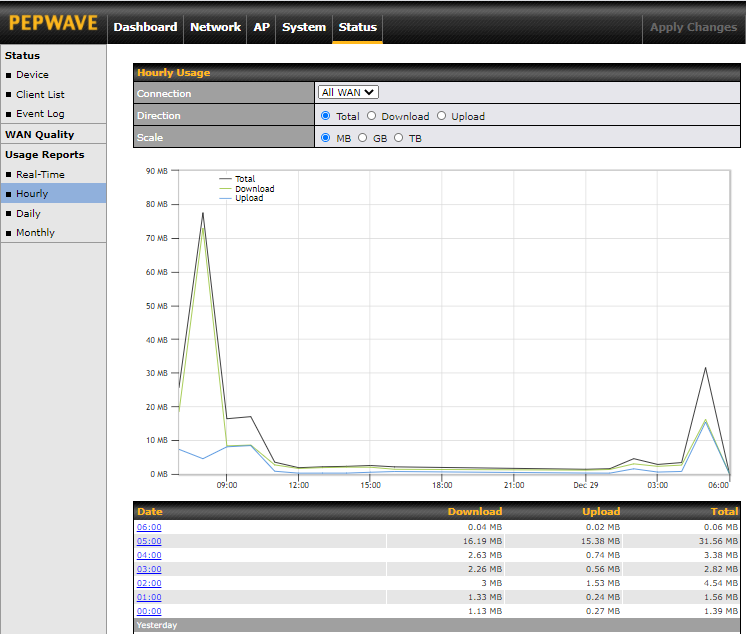
This page shows the hourly bandwidth usage for all WAN connections. Individual connections may be viewed by selecting the desired connection from the drop-down menu.
10.6.3. Daily
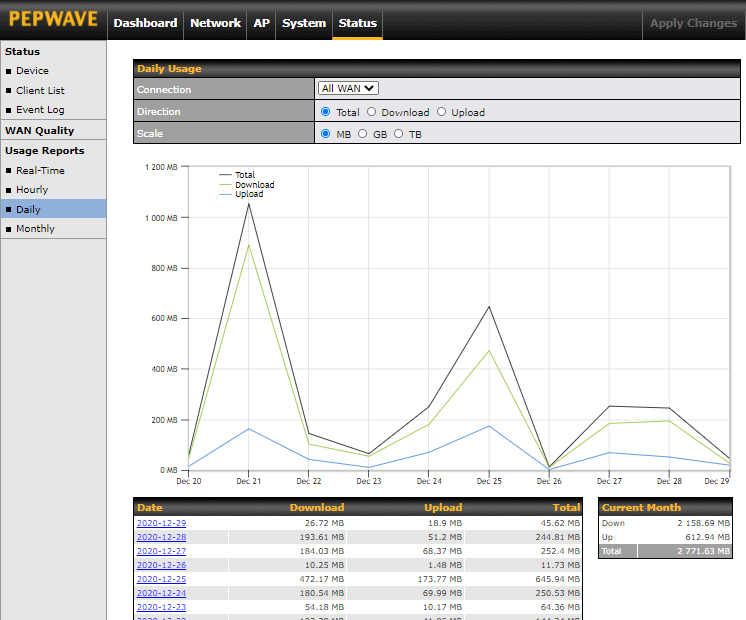
This page shows the daily bandwidth usage for all WAN connections. Individual connections may be viewed by selecting the connection from the drop-down menu. You can check the Current Billing Cycle table for that WAN connection to be displayed. Click on a date to view the client bandwidth usage of that specific date. The scale of the graph can be set to display megabytes (MB), gigabytes (GB), or terabytes (TB).
10.6.4. Monthly
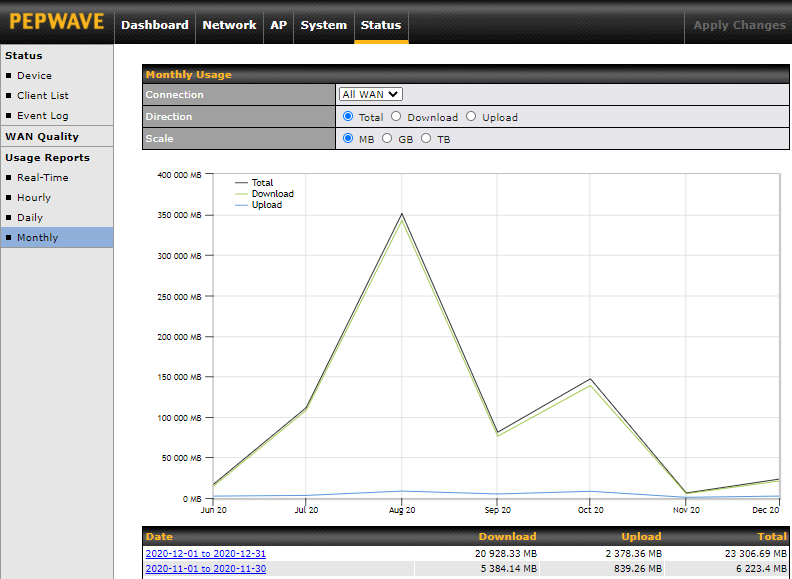
This page shows the monthly bandwidth usage for each WAN connection. You can check the usage of each particular connection and view the information by Billing Cycle or by Calendar Month. Select the first two rows to view the client bandwidth usage for the last two months. The scale of the graph can be set to display megabytes (MB), gigabytes (GB), or terabytes (TB).